Author Archive

Almanac Update November 2019: First Month of Best 3 Consecutive Month Span

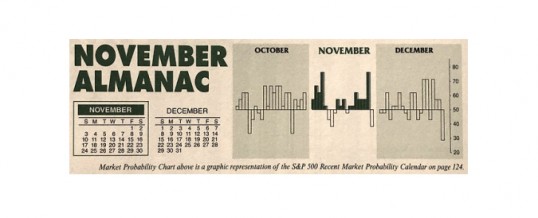
November maintains its status among the top performing months as fourth-quarter cash inflows from institutions drive November to lead the best consecutive three-month span November-January. However, the month has taken hits during bear markets and November 2000, down –22.9% (undecided election and a nascent bear), was NASDAQ’s second worst month on record—only October 1987 was worse.

November begins the “Best Six Months” for the DJIA and S&P 500, and the “Best Eight Months” for NASDAQ. Small caps come into favor during ...

Continue Reading →
0

Market Outlook October 2019: Octoberphobia Sets Up Best Six Months

Amid all the news and noise U.S. financial markets continue to track the seasonal and 4-year election cycle patterns closely as they has all year long. Our strategy that employs and utilizes seasonality is outperforming the market.

Amazingly, 2019 market price action continues to track the historical trend and pattern as you can see in the updated chart of Pre-Election Year Seasonal Patterns overlaid with 2019. On cue stocks paused at resistance below the highs in the third week of ...

Continue Reading →
0

Almanac Update October 2019: Second Worst Month in Pre-Election Years

October often evokes fear on Wall Street as memories are stirred of crashes in 1929, 1987, the 554-point drop on October 27, 1997, back-to-back massacres in 1978 and 1979, Friday the 13th in 1989 and the 733-point drop on October 15, 2008. During the week ending October 10, 2008, Dow lost 1,874.19 points (18.2%), the worst weekly decline in our database going back to 1901, in point and percentage terms. The term “Octoberphobia” has been used to describe the phenomenon ...

Continue Reading →
0

Almanac Update September 2019: The Other Worst Month

The start of business year, end of summer vacations, and back to school made September a leading barometer month in first 60 years of the 20th century, now portfolio managers back after Labor Day tend to clean house Since 1950, September is the worst performing month of the year for DJIA, S&P 500, and NASDAQ (since 1971). September was creamed four years straight from 1999-2002 after four solid years from 1995-1998 during the dot.com bubble madness. September gets no respite ...

Continue Reading →
0

Market Outlook September 2019: Volatility Continues & End Q3 Weakness

Last month we warned that the market was ripe for a seasonal pullback. Within days of our monthly missive late-July and early-August delivered their typical seasonal weakness, of course with a little help from the Fed, yield curve and hot-button geopolitics. At the risk of sounding like a broken record, we expect the market to continue to track the seasonal and 4-year election cycle patterns closely as it has all year long.

Our updated chart of Pre-Election Year Seasonal Patterns overlaid ...

Continue Reading →
0

Almanac Update August 2019: Worst Performing Month of Year Over Last 31 Years

Money flows from harvesting made August a great stock market month in the first half of the Twentieth Century. It was the best month from 1901 to 1951. In 1900, 37.5% of the population was farming. Now that less than 2% farm, August is amongst the worst months of the year. It is the worst DJIA, S&P 500 and NASDAQ month over the last 31 years, 1988-2018 with average declines ranging from 0.1% by NASDAQ to 1.1% by DJIA. In ...

Continue Reading →
0

Market Outlook August 2019: Ripe For A Seasonal Pullback

Major U.S. stock market indices continue to track historic seasonal patterns and the historical seasonal pattern for Pre-Election Years quite closely this year and that suggests it is likely to continue to do so. The Dow, S&P 500 and NASDAQ have just logged new all-time highs and while that is bullish for the year as a hole and the second half in general it does indicate that we are ripe for a seasonal pullback.

As you can see in the accompanying ...

Continue Reading →
0
Page 9 of 16 «...7891011...»