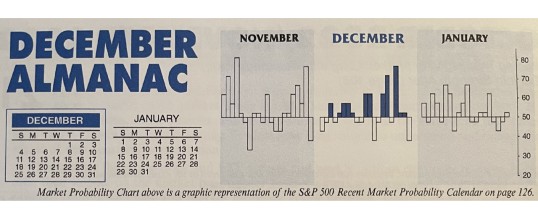
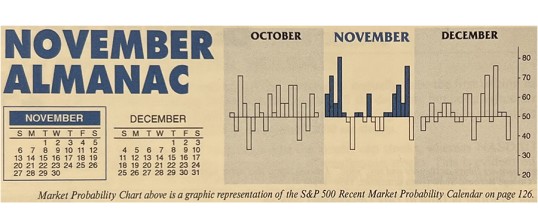
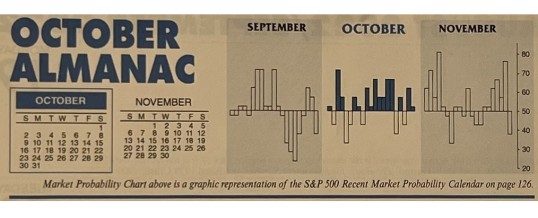
Posts Tagged 'S&P 500'

December 2022 Outlook: Yearend Rally Climbs Wall of Worry

It was encouraging for the S&P 500 to close above the big round 4000 number during the Thanksgiving week. Across-the-board gains in the major averages and sectors were also constructive. We believe reclaiming 4000 and then the 200-day moving average would be supportive. We remain bullish on the yearend rally and the prospect for continuing gains into 2023, but not without concerns for the headwinds the market faces from inflation, Fed rate hikes, geopolitics and further fallout from the crypto ...

Continue Reading →
0

Almanac Update December 2022: Tepid Start, But Solid Finish

December is the number three S&P 500 and Dow Jones Industrials month since 1950, averaging gains of 1.5% and 1.6% respectively. It’s the second-best Russell 2000 (1979) month and fourth best for NASDAQ (1971). In 2018, DJIA suffered its worst December performance since 1931 and its fourth worst December going all the way back to 1901. However, the market rarely falls precipitously in December and a repeat of 2018 does not seem highly likely this year. When December is down ...

Continue Reading →
0

November 2022 Market at a Glance

Seasonal:

Bullish. November is the 1st month of the “Best Six/Eight Months,” and the 1st month of the best three consecutive months November through January. Midterm November is also the 1st month of the best six consecutive month period and the Sweet Spot of the four-year cycle. #2 DJIA, S&P 500 and NASDAQ month of the year. NASDAQ’s best month in ...

Continue Reading →
0

November 2022 Outlook: Welcome to the Sweet Spot

The jury is still out on whether October has killed another bear market. But with the Dow up 11.5% so far in October 2022, it is on pace to record its best October performance ever going back to 1901. While many analysts, technicians and pundits continue their deliberations we lean toward the case that we have entered a new bull market – at least for the near term. Sure, we have concerns and recognize the many headwinds the market faces, ...

Continue Reading →
0

Almanac Update November 2022: DJIA & S&P 500 Second Best Month in Midterm Years

November maintains its status among the top performing months as fourth-quarter cash inflows from institutions drive November to lead the best consecutive three-month span November-January. However, the month has taken hits during bear markets and November 2000, down –22.9% (undecided election and a nascent bear), was NASDAQ’s second worst month on record—only October 1987 was worse.

November begins the “Best Six Months” for the DJIA and S&P 500, and the “Best Eight Months” for NASDAQ. Small caps come into favor during ...

Continue Reading →
0

October 2022 Market at a Glance

Seasonal:

Improving. October is the last month of DJIA and S&P 500 “Worst Six Months” and NASDAQ’s “Worst Four Months.” Twelve post-WWII bear markets have ended in October and seven were in midterm years. October is the #1 DJIA and S&P 500 month in midterm years, #2 for NASDAQ. STA Seasonal MACD Buy signal can trigger any time after ...

Continue Reading →
0

October 2022 Outlook: Bear-Killer and Bargain Month

We coined the term “bear-killer” for October way back in 1968 in the 1969 Stock Trader’s Almanac, the second edition. The original theory from the 1969 Almanac still holds water.

October has been the big bargain month of the post-World War II era. Its chief asset is its enviable position in the calendar. It falls in front of the most bullish three-month span of the year (November, December and January). At this time, volume picks up considerably and there is a ...

Continue Reading →
0

Almanac Update October 2022: Top Month in Midterm Years

October can evoke fear on Wall Street as memories are stirred of crashes in 1929, 1987, the 554-point DJIA drop on October 27, 1997, back-to-back massacres in 1978 and 1979, Friday the 13th in 1989 and the 733-point DJIA drop on October 15, 2008. During the week ending October 10, 2008, DJIA lost 1,874.19 points (18.2%), the worst weekly decline, in percentage terms, in our database going back to 1901. March 2020 now holds the dubious honor of producing the ...

Continue Reading →
0

September 2022 Market at a Glance

Seasonal:

Bearish. September is the worst DJIA, S&P 500, NASDAQ, and Russell 2000 month of the year by average performance. Average declines range from –0.5% to –0.7%. Midterm-year Septembers have been mixed notwithstanding a modest improvement in rank. DJIA has declined in 11 of the last 18 midterm-year Septembers. End-of-quarter window dressing and rebalancing has contributed to some nasty, late-September selloffs.

Continue Reading →
0

Page 1 of 19 12345...»