Posts Tagged 'pre-election year'

Almanac Update December 2019: If Santa Claus Should Fail to Call, Bears May Come to Broad and Wall

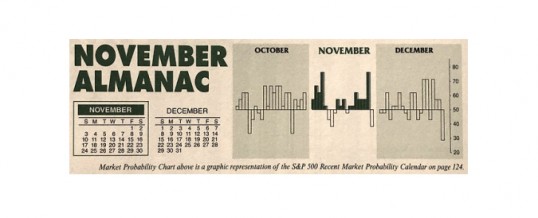
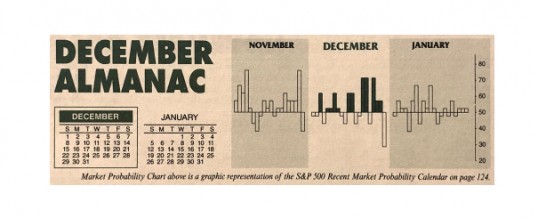
December is now the number two S&P 500 month and the third best month on the Dow Jones Industrials since 1950, averaging gains of 1.5% on each index. It’s the third best month for NASDAQ since 1971. Last year DJIA suffered its worst December performance since 1931 and its fourth worst December going all the way back to 1901. However, the market rarely falls precipitously in December and a repeat of last year is not that likely. When it does ...

Continue Reading →
0

Market Outlook November 2019: Best Six Months Underway

Despite scary trading on Halloween spooked by the latest trade and impeachment fears, the market has been rising steadily since our October 11 Seasonal Best Six Months MACD Buy Signal. Our defensive positions did well while the market gained little ground from our May 1st Sell Signal until our October 11 Buy Signal.

Now that we’ve survived Octoberphobia and the market has begun to strengthen again, breaking out above support and logging new highs on the S&P 500, we are likely ...

Continue Reading →
0

Almanac Update November 2019: First Month of Best 3 Consecutive Month Span

November maintains its status among the top performing months as fourth-quarter cash inflows from institutions drive November to lead the best consecutive three-month span November-January. However, the month has taken hits during bear markets and November 2000, down –22.9% (undecided election and a nascent bear), was NASDAQ’s second worst month on record—only October 1987 was worse.

November begins the “Best Six Months” for the DJIA and S&P 500, and the “Best Eight Months” for NASDAQ. Small caps come into favor during ...

Continue Reading →
0

Market Outlook October 2019: Octoberphobia Sets Up Best Six Months

Amid all the news and noise U.S. financial markets continue to track the seasonal and 4-year election cycle patterns closely as they has all year long. Our strategy that employs and utilizes seasonality is outperforming the market.

Amazingly, 2019 market price action continues to track the historical trend and pattern as you can see in the updated chart of Pre-Election Year Seasonal Patterns overlaid with 2019. On cue stocks paused at resistance below the highs in the third week of ...

Continue Reading →
0

Almanac Update October 2019: Second Worst Month in Pre-Election Years

October often evokes fear on Wall Street as memories are stirred of crashes in 1929, 1987, the 554-point drop on October 27, 1997, back-to-back massacres in 1978 and 1979, Friday the 13th in 1989 and the 733-point drop on October 15, 2008. During the week ending October 10, 2008, Dow lost 1,874.19 points (18.2%), the worst weekly decline in our database going back to 1901, in point and percentage terms. The term “Octoberphobia” has been used to describe the phenomenon ...

Continue Reading →
0

Market Outlook September 2019: Volatility Continues & End Q3 Weakness

Last month we warned that the market was ripe for a seasonal pullback. Within days of our monthly missive late-July and early-August delivered their typical seasonal weakness, of course with a little help from the Fed, yield curve and hot-button geopolitics. At the risk of sounding like a broken record, we expect the market to continue to track the seasonal and 4-year election cycle patterns closely as it has all year long.

Our updated chart of Pre-Election Year Seasonal Patterns overlaid ...

Continue Reading →
0

Market Outlook May 2019: Market Prone to Short-Term Weakness in May

After a rough start to the “Best Six Months” with the market falling precipitously in November-December the recovery rally has put DJIA up 5.9%, S&P 500 up 8.6% and NASDAQ up 10.8% for the Best Six Months November-April from the October 31, 2018 close to the April 30, 2019 close. The history of the Best Six/Worst Six Months is impressive, though there have been off periods throughout its history. But now as the Best Six Months has come to a ...

Continue Reading →
0

Almanac Update May 2019: Challenging Month in Pre-Election Years

May officially marks the beginning of the “Worst Six Months” for the DJIA and S&P. To wit: “Sell in May and go away.” Our “Best Six Months Switching Strategy,” created in 1986, proves that there is merit to this old trader’s tale. A hypothetical $10,000 investment in the DJIA compounded to a gain of $1,008,519 for November-April in 68 years compared to just $1,031 for May-October. The same hypothetical $10,000 investment in the S&P 500 compounded to $720,389 for November-April ...

Continue Reading →
0

Almanac Update February 2019: Generally a Tepid Month for Large Caps

Even though February is right in the middle of the Best Six Months, its long-term track record, since 1950, is not all that stellar. February ranks no better than seventh and has posted paltry average gains except for the Russell 2000. Small cap stocks, benefiting from “January Effect” carry over; tend to outpace large cap stocks in February. The Russell 2000 index of small cap stocks turns in an average gain of 1.1% in February since 1979—just the seventh best ...

Continue Reading →
0

Market Outlook January 2019 & Annual Forecast: Santa on Notice from Dueling Grinches – Low Nears – Bear Lurks

Fed Chairman Powell and President Trump have been competing for who can freak the market out most. Our contention for months has been that the Fed is the biggest risk to the market and economy and that surely seems to have come home to roost the past few months and this week.

Last month in our “Market at a Glance” we said that, “After nearly a decade at zero, a brief pause to evaluate the impact of recent hikes does not ...

Continue Reading →
0