

Amid all the news and noise U.S. financial markets continue to track the seasonal and 4-year election cycle patterns closely as they has all year long. Our strategy that employs and utilizes seasonality is outperforming the market.
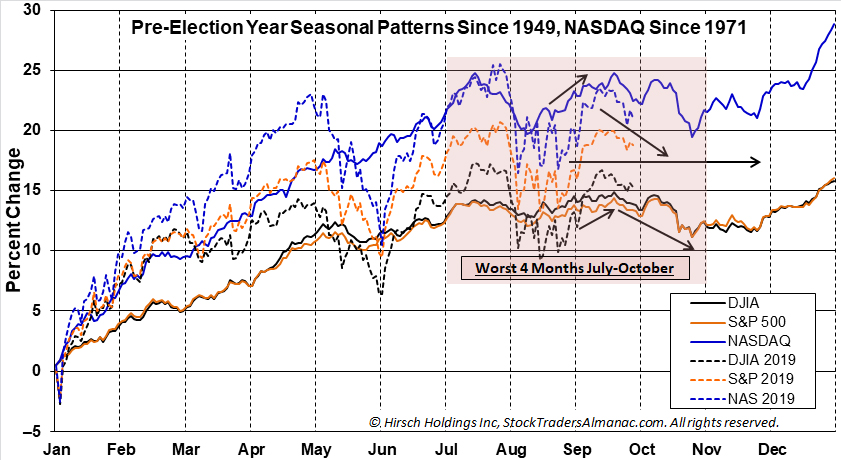
Amazingly, 2019 market price action continues to track the historical trend and pattern as you can see in the updated chart of Pre-Election Year Seasonal Patterns overlaid with 2019. On cue stocks paused at resistance below the highs in the third week of September and appear to be turning lower. This suggests 2019 will continue to move in synch with the seasonal moves depicted on the chart. So we expect support to be tested in the volatile month of October, which is the 2nd worst month in Pre-Election Years.
The negative news flow from election campaigning, impeachment proceedings, trade wars and Mideast hostilities is likely to feed into what can become the self-fulfilling prophecy of Octoberphobia so it will be important to keep our emotions in check and stick to our system.
Unfortunately, history provides little guidance on presidential impeachment proceedings. Andrew Johnson (1868) and Bill Clinton (1998) were the only two presidents ever impeached and both were acquitted in the Senate trial. Richard Nixon (1974) resigned before his likely impeachment. These were the only three presidents to ever be the subject of formal impeachment charges.
We have little market data from 1868, but after Johnson’s acquittal he failed to gain the nomination at the 1868 Democratic National Convention to run for president for another term. A stock market panic and recession ensued in 1869 as the country struggled through the Reconstruction. When Nixon resigned in 1974 the market was already near the end of a long bear market. The shortest bear market on record caused by the collapse of Long Term Capital Management and the global debt crisis ended on August 31, 1998 months before Clinton’s impeachment.
October market volatility could test support at S&P 2815 or even down to 2725. Afterwards a rally into the end of Q4 with new highs near year end is possible.
SEP
2019