
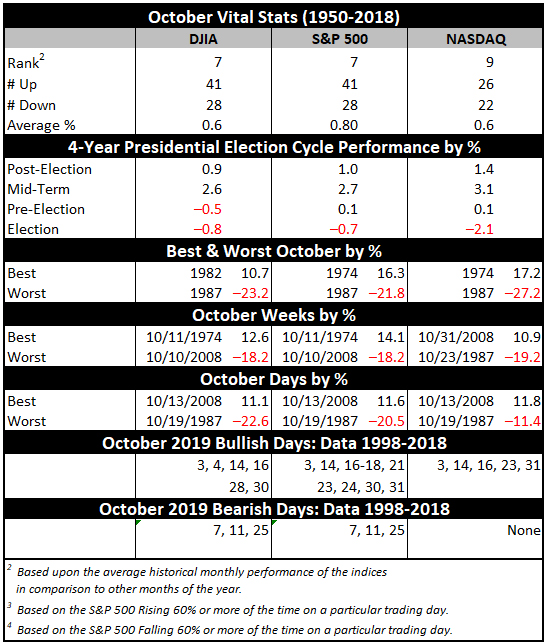
October often evokes fear on Wall Street as memories are stirred of crashes in 1929, 1987, the 554-point drop on October 27, 1997, back-to-back massacres in 1978 and 1979, Friday the 13th in 1989 and the 733-point drop on October 15, 2008. During the week ending October 10, 2008, Dow lost 1,874.19 points (18.2%), the worst weekly decline in our database going back to 1901, in point and percentage terms. The term “Octoberphobia” has been used to describe the phenomenon of major market drops occurring during the month. Market calamities can become a self-fulfilling prophecy, so stay on the lookout and don’t get whipsawed if it happens.
But October has become a turnaround month—a “bear killer” if you will. Twelve post-WWII bear markets have ended in October: 1946, 1957, 1960, 1962, 1966, 1974, 1987, 1990, 1998, 2001, 2002 and 2011 (S&P 500 declined 19.4%). However, eight were midterm bottoms. Over the last 21 years, October’s performance has been solid. Average gains in over the last 21-years range from 1.7% by the S&P 500 to 2.5% by NASDAQ.
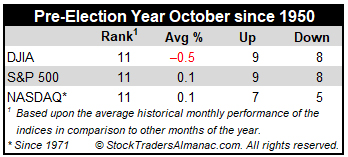
Pre-election year Octobers are ranked second from last for DJIA, S&P 500 and NASDAQ. Eliminating gruesome 1987 from the calculation provides only a moderate amount of relief. Should a meaningful decline materialize in October it is likely to be an excellent buying opportunity, especially for depressed technology and small-cap shares.
SEP
2019