Posts Tagged '$^RUT'

Almanac Update March 2019: Even Better in Pre-Election Years

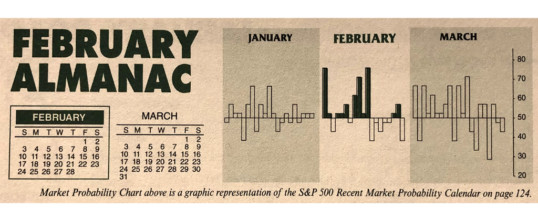
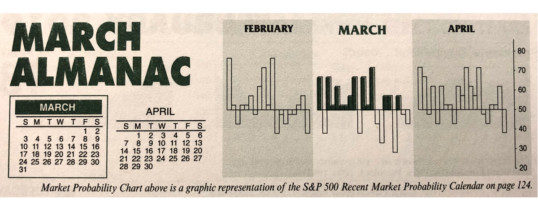
Turbulent March markets tend to drive prices up early in the month and batter stocks at month end. Julius Caesar failed to heed the famous warning to “beware the Ides of March” but investors have been served well when they have. Stock prices have a propensity to decline, sometimes rather precipitously, during the latter days of the month. In March 2001, DJIA plunged 1469 points (-13.5%) from March 9 to the 22.

March packs a rather busy docket. It is the ...

Continue Reading →
0

Market Outlook February 2019: Market Internals Support Rally & Solid 2019 Gains

The Dow posted a 7.2% gain for the month of January – not only its best monthly gain in the past three months, but its best January since 1989. S&P 500 outpaced the Dow with a 7.9% gain for the month – its best January since 1987, scoring our third January Indicator Trifecta in a row. Further details on the bullish implications of the January Indicator Trifecta can be seen here “January Barometer 2019 Official Results.

NASDAQ stocks ...

Continue Reading →
0

Almanac Update February 2019: Generally a Tepid Month for Large Caps

Even though February is right in the middle of the Best Six Months, its long-term track record, since 1950, is not all that stellar. February ranks no better than seventh and has posted paltry average gains except for the Russell 2000. Small cap stocks, benefiting from “January Effect” carry over; tend to outpace large cap stocks in February. The Russell 2000 index of small cap stocks turns in an average gain of 1.1% in February since 1979—just the seventh best ...

Continue Reading →
0

Almanac Update January 2019: Top Month for Stocks in Pre-Election Years

January has quite a legendary reputation on Wall Street as an influx of cash from yearend bonuses and annual allocations typically propels stocks higher. January ranks #1 for NASDAQ (since 1971), but sixth on the S&P 500 and DJIA since 1950. It is the end of the best three-month span and holds a full docket of indicators and seasonalities.

DJIA and S&P rankings did slip from 2000 to 2018 as both indices suffered losses in ten of those nineteen Januarys with ...

Continue Reading →
0

Market Outlook December 2018: Season of the Rally

It is the season for rallies, but not the Santa Claus Rally quite yet. As I reiterated once again earlier this week on my blog, the Santa Claus Rally is not any seasonal rally in the fourth quarter of the year or around yearend, it is the usual short, sweet, respectable rally Santa brings to Wall Street within the last five days of the year and the first two in January.

The Santa Claus Rally was discovered and named by ...

Continue Reading →
0

Typical September Trading: Another Historically Challenging Month

Although August is the worst month of the year for the market since 1987 (recent 31-year period), September is the worst month going back to 1950 for DJIA and S&P 500. It is also the worst month for NASDAQ since 1971 and the worst for Russell 1000 and 2000 since 1979. Looking at the full month of September one day at a time, just before mid-month has offered the bulls the best opportunity with the chart exhibiting strength from around ...

Continue Reading →
0

Hot July Market Blazes Past Historical Performance

As of today’s close DJIA is up 3.18% thus far in July. S&P 500 is slightly better at 3.26% while Russell 2000 is up 3.37%. NASDAQ is best up 4.41% with another six trading sessions to go in the month. As you can see in the chart below this is well above average historical July performance at this point of the month over the last 21 years. Early month strength (trading days three, four and five) was substantially greater this ...

Continue Reading →
0

Seasonal Research May 2018: Russell 2000 & Small Caps Best Record Week before Memorial Day Weekend

Over the last 21 years, DJIA has advanced just 47.6% of the time during the week before Memorial Day weekend. Of the five major indices we frequently cite, it is the weakest averaging a 0.29% loss. S&P 500, NASDAQ and Russell 1000 are better, but average performance over the last 21 years is still just a fractional gain. Russell 2000 has the best track record, up 71.4% of the time with an average gain of 0.42%. Since 2003, Russell 2000 ...

Continue Reading →
0

Seasonal Research March 2018: First Trading Day of Q2 DJIA and S&P 500 Advance 75.0% of the Time


According to the Stock Trader’s Almanac 2018, the first trading day of April is DJIA’s second best first trading day of months based upon total points gained. Only May’s first trading day is stronger. Looking back at the last 24 years, in the tables below, we can see DJIA and S&P 500 have both advanced 75.0% of the time (up 18 of last 24) with average gains right around 0.5%. NASDAQ and Russell 2000 have slightly weaker track records and smaller ...

Continue Reading →
0

Almanac Update February 2018: Big January Gains Correct or Consolidate in February

February tends to follow the current trend, though big January gains often correct or consolidate during the month of Valentines and Presidents as Wall Street evaluates and adjusts market outlooks based on January’s performance. Since 1950, January S&P 500 gains of 2% or more corrected or consolidated in February 62.1% of the time. In the 20 years that the S&P 500 gained 4% or more in January, 65.0% of the time the S&P declined or finished flat (less than 1% ...

Continue Reading →
0