
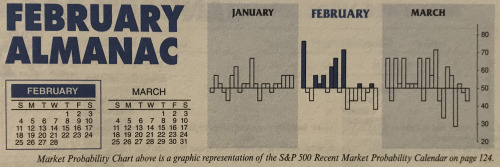
February tends to follow the current trend, though big January gains often correct or consolidate during the month of Valentines and Presidents as Wall Street evaluates and adjusts market outlooks based on January’s performance. Since 1950, January S&P 500 gains of 2% or more corrected or consolidated in February 62.1% of the time. In the 20 years that the S&P 500 gained 4% or more in January, 65.0% of the time the S&P declined or finished flat (less than 1% gain) in February.
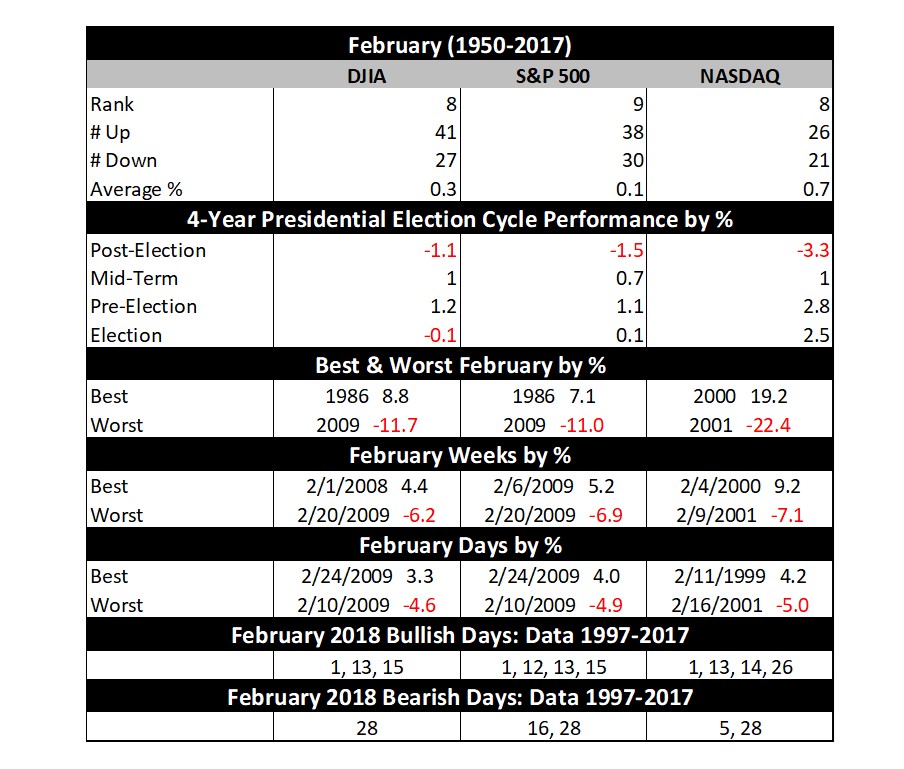
Since 1950, February is up only slightly more than half the time and up marginally on average. However, small cap stocks, benefiting from “January Effect” carry over; tend to outpace large cap stocks in February. The Russell 2000 index of small cap stocks turns in an average gain of 1.2% in February since 1979—just the seventh best month for that benchmark.
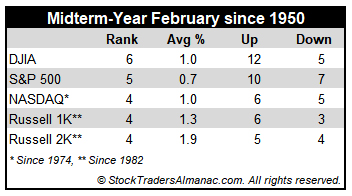
In midterm years, February’s performance generally improves with average returns all increasing. Here again it is the Russell 2000 small-cap index that shines brightest gaining 1.9% on average since 1982. Russell 1000 is second best, averaging gains of 1.3% since 1982. DJIA and NASDAQ average gains of 1.0% (since 1950 and 1974 respectively) while S&P 500 lags with average advance of 0.7% (since 1950).
The first trading day is bullish and it has traded higher in 19 of the past 26 years with an average S&P 500 gain of 0.43%. The Russell 1000 is even stronger, up 21 of the last 26 with an average gain near 0.45%. Strength then tends to fade after that until the stronger eighth, ninth and eleventh trading days. Expiration week has a spotty longer-term record, but the week after has a clear negative bias with average losses across the board over the past 28 years.
Presidents’ Day is the lone holiday that exhibits weakness the day before and after (Stock Trader’s Almanac 2018, page 88). The Friday before this mid-winter three-day break is exceptionally treacherous and average declines persist for three trading days after the holiday going back to 1980. More recently, since 2011, the day before and the day after Presidents’ Day has been improving. S&P 500 has advanced six times in seven years on the day before and has been up on the day after for six straight years.
FEB
2018