
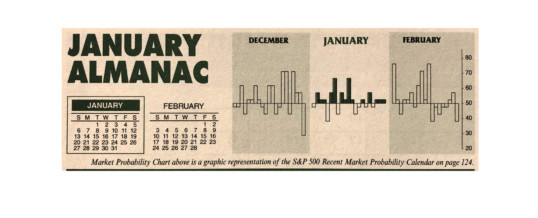
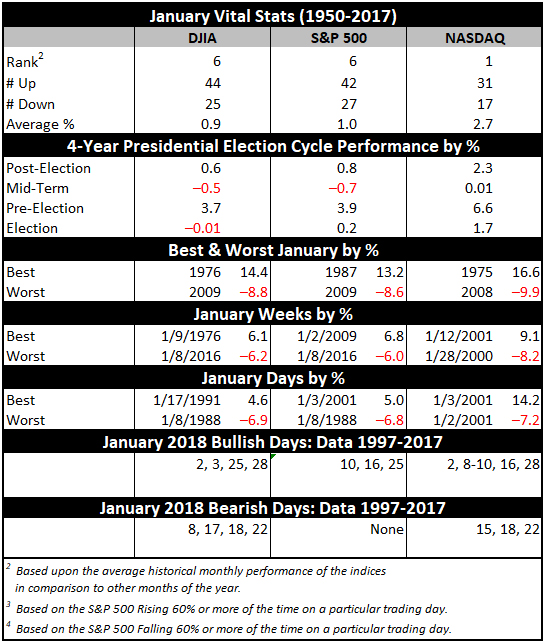
January has quite a legendary reputation on Wall Street as an influx of cash from yearend bonuses and annual allocations typically propels stocks higher. January ranks #1 for NASDAQ (since 1971), but sixth on the S&P 500 and DJIA since 1950. It is the end of the best three-month span and holds a full docket of indicators and seasonalities.
DJIA and S&P rankings did slip from 2000 to 2018 as both indices suffered losses in ten of those nineteen Januarys with three in a row, 2008, 2009 and 2010. January 2009 has the dubious honor of being the worst January on record for DJIA (-8.8%) and S&P 500 (-8.6%) since 1901 and 1931 respectively. Despite late-month weakness in 2018, S&P 500 still gained 5.6% and DJIA jumped 5.8%.
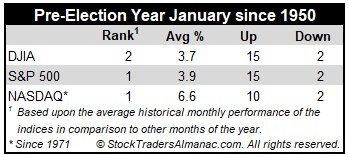
In pre-election years, Januarys have been downright stellar ranking #1 for S&P 500 and NASDAQ and #2 for DJIA. Average gains range from 3.7% on DJIA to a whopping 6.6% for NASDAQ.
On pages 108 and 110 of the Stock Trader’s Almanac 2019 we illustrate that the January Effect, where small caps begin to outperform large caps, actually starts in mid-December. Thus far, signs of this have been absent when comparing Russell 2000 to S&P 500 as broad weakness up to Christmas Eve depressed most shares. The majority of small-cap outperformance is normally done by mid-February, but strength can last until mid-May when indices typically reach a seasonal high.
The first indicator to register a reading in January is the Santa Claus Rally. The seven-trading day period began on the open on December 24 and ends with the close of trading on January 3. Normally, the S&P 500 posts an average gain of 1.3%. The failure of stocks to rally during this time tends to precede bear markets or times when stocks could be purchased at lower prices later in the year.
On January 8, our First Five Days “Early Warning” System will be in. In pre-presidential election years this indicator has a solid record. In the last 17 pre-presidential election years 12 full years followed the direction of the First Five Days. 1955, 1991, 2007, 2011 and 2015 did not. The full-month January Barometer has an even better pre-presidential-election-year record as 15 of the last 17 full years have followed January’s direction.
Our flagship indicator, the January Barometer created by Yale Hirsch in 1972, simply states that as the S&P goes in January so goes the year. It came into effect in 1934 after the Twentieth Amendment moved the date that new Congresses convene to the first week of January and Presidential inaugurations to January 20.
The long-term record has been stupendous, an 86.8% accuracy rate, with only nine major errors in 68 years. Major errors occurred in the secular bear market years of 1966, 1968, 1982, 2001, 2003, 2009, 2010 and 2014 and again in 2016 as a mini bear came to an end. The market’s position on January 31 will give us a good read on the year to come. When all three of these indicators are in agreement it has been prudent to heed their call.
JAN
2019