Posts Tagged '4-year cycle'

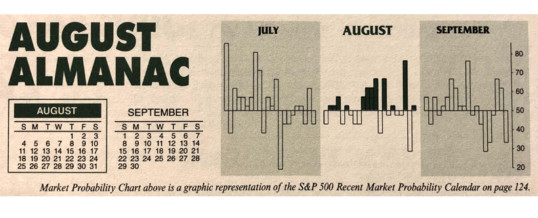
Almanac Update August 2019: Worst Performing Month of Year Over Last 31 Years

Money flows from harvesting made August a great stock market month in the first half of the Twentieth Century. It was the best month from 1901 to 1951. In 1900, 37.5% of the population was farming. Now that less than 2% farm, August is amongst the worst months of the year. It is the worst DJIA, S&P 500 and NASDAQ month over the last 31 years, 1988-2018 with average declines ranging from 0.1% by NASDAQ to 1.1% by DJIA. In ...

Continue Reading →
0

Market Outlook August 2019: Ripe For A Seasonal Pullback

Major U.S. stock market indices continue to track historic seasonal patterns and the historical seasonal pattern for Pre-Election Years quite closely this year and that suggests it is likely to continue to do so. The Dow, S&P 500 and NASDAQ have just logged new all-time highs and while that is bullish for the year as a hole and the second half in general it does indicate that we are ripe for a seasonal pullback.

As you can see in the accompanying ...

Continue Reading →
0

Market Outlook July 2019: Big June Gains Hazardous for July – Worst 4 Months Prep

As you can see in the accompanying chart the U.S. stock market has been tracking rather close to the historical seasonal pattern for Pre-Election Years. As we have pointed out here the past several months, outsized gains are to be expected this year based on the Pre-Election Year pattern illustrated in the chart, especially following our positive January Indicator Trifecta. But we have also warned these gains would not come without pause and correction.

After the third best first-four-month start to ...

Continue Reading →
0

Almanac Update July 2019: Luke Warm in Pre-Election Years

July historically is the best performing month of the third quarter however, the mostly negative results in August and September make the comparison easy. Two “hot” Julys in 2009 and 2010 where DJIA and S&P 500 both gained greater than 6% and a strong performance in 2013 have boosted July’s average gains since 1950 to 1.2% and 1.1% respectively. Such strength inevitability stirs talk of a “summer rally”, but beware the hype, as it has historically been the weakest rally ...

Continue Reading →
0

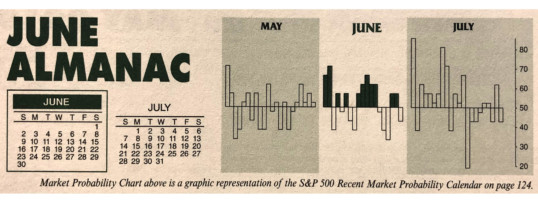
Almanac Update June 2019: Better in Pre-Election Years

June has shone brighter on NASDAQ stocks over the last 48 years as a rule ranking eighth with a 0.6% average gain, up 26 of 48 years. This contributes to NASDAQ’s “Best Eight Months” which ends in June. June ranks near the bottom on the Dow Jones Industrials just above September since 1950 with an average loss of 0.3%. S&P 500 performs similarly poorly, ranking tenth, but essentially flat (–0.02% average).

In pre-election years since 1950, June ranks no better than ...

Continue Reading →
0

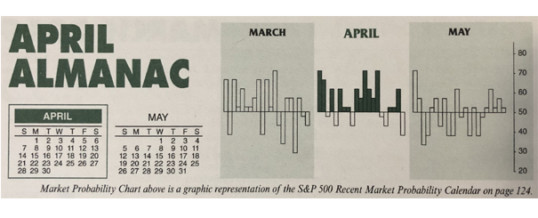
Almanac Update April 2019: Up Thirteen Years in a Row

The first trading day of April and the second quarter, has enjoyed notable strength over the past 24 years, advancing 17 times with an average gain of 0.37% in all 24 years for S&P 500. However, four of the seven declines have occurred in the last six years. Other declines were in 2001, 2002 and 2005. DJIA’s record on April’s first trading day matches the S&P 500, 17 advances in 24 years. NASDAQ recent performance is slightly weaker than DJIA ...

Continue Reading →
0

Market Outlook April 2019: End Q1 Consolidation Resolves Higher In April

April is the last month of DJIA’s and S&P 500’s “Best Six Months” of the year. As you can see in the accompanying chart of the “Pre-Election Year Seasonal Patterns” the major U.S. stock market indices have historically rallied quite sharply through April. Then DJIA in black and S&P 500 in green historically begin to move sideways at the beginning of the “Worst Six Months” (Sell in May) in May and June while NASDAQ in blue continues to run higher ...

Continue Reading →
0

Market Outlook March 2019: Rally Intact Pausing at Resistance & Seasonal Weak Spots

Since Christmas the market has ripped higher on supportive market internals, still solid overall fundamentals and improving technicals. In line with the Seasonal Market Probability Calendar (graphically represented on page 20 of the Stock Trader’s Almanac 2019 in the “February Almanac”) the market succumbed to usual February weakness after the first few days of the month and again around the Presidents’ Day holiday and again today on the usually bearish last trading day of the month.

As you can see in ...

Continue Reading →
0

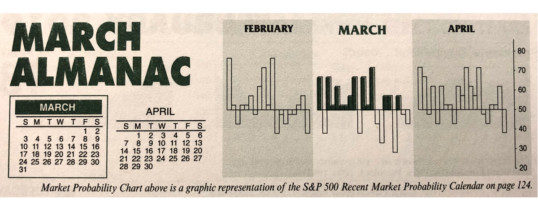
Almanac Update March 2019: Even Better in Pre-Election Years

Turbulent March markets tend to drive prices up early in the month and batter stocks at month end. Julius Caesar failed to heed the famous warning to “beware the Ides of March” but investors have been served well when they have. Stock prices have a propensity to decline, sometimes rather precipitously, during the latter days of the month. In March 2001, DJIA plunged 1469 points (-13.5%) from March 9 to the 22.

March packs a rather busy docket. It is the ...

Continue Reading →
0

Market Outlook February 2019: Market Internals Support Rally & Solid 2019 Gains

The Dow posted a 7.2% gain for the month of January – not only its best monthly gain in the past three months, but its best January since 1989. S&P 500 outpaced the Dow with a 7.9% gain for the month – its best January since 1987, scoring our third January Indicator Trifecta in a row. Further details on the bullish implications of the January Indicator Trifecta can be seen here “January Barometer 2019 Official Results.

NASDAQ stocks ...

Continue Reading →
0
Page 1 of 3 123