
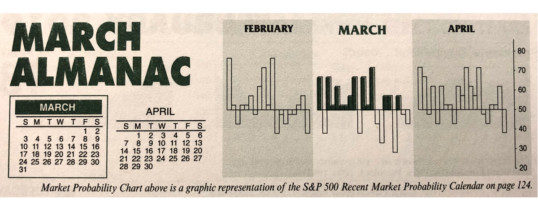
Turbulent March markets tend to drive prices up early in the month and batter stocks at month end. Julius Caesar failed to heed the famous warning to “beware the Ides of March” but investors have been served well when they have. Stock prices have a propensity to decline, sometimes rather precipitously, during the latter days of the month. In March 2001, DJIA plunged 1469 points (-13.5%) from March 9 to the 22.
March packs a rather busy docket. It is the end of the first quarter, which brings with it quarterly stock and index options and index futures expiration on the third Friday (AKA “Triple Witching”) that have a history of driving an abundance of portfolio maneuvers from The Street. March Triple-Witching Weeks have been quite bullish in recent years. But the week after is the exact opposite, DJIA down 21 of the last 31 years—and frequently down sharply for an average drop of 0.50%. In 2018, DJIA lost 1413 points (–5.67%) Notable gains during the week after for DJIA of 4.9% in 2000, 3.1% in 2007, 6.8% in 2009, and 3.1% in 2011 are the rare exceptions to this historically poor performing timeframe.
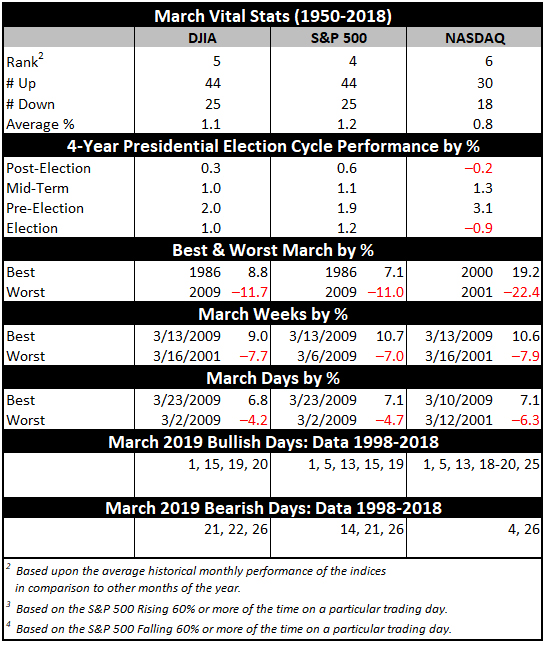
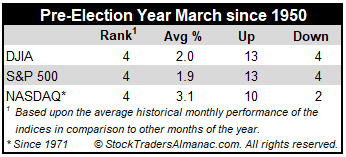
Normally a decent performing market month, March performs even better in pre-election years (see Vital Stats table). In pre-election years March ranks: 4th best for DJIA, S&P 500, NASDAQ and Russell 1000 (January, April and December are better). Pre-election year March ranks #3 for Russell 2000. Pre-election year March has been up 13 out of the last 14 for DJIA. In fact, since inception in 1979, the Russell 2000 has a perfect, 10-for-10 winning record.
Saint Patrick’s Day is March’s sole recurring cultural event. Gains the day before Saint Patrick’s Day have proved to be greater than the day itself and the day after. Perhaps it’s the anticipation of the patron saint’s holiday that boosts the market and the distraction from the parade down Fifth Avenue that causes equity markets to languish. Or maybe it’s the fact that Saint Pat’s usually falls in historically bullish Triple-Witching Week.
Whatever the case, since 1950, the S&P 500 posts an average gain of 0.19% on Saint Patrick’s Day (or the next trading day when it falls on a weekend), a gain of 0.13% the day after and the day before averages a 0.24% advance. S&P 500 median values are 0.17% on the day before, 0.20% on Saint Patrick’s Day and 0.07% on the day after. In the nine years when St. Patrick’s Day falls on a Sunday, like this year, since 1950, the day before (Friday) produced an average gain of 0.15%, while Monday declined an average 0.08%.
MAR
2019