Posts Tagged 'January Barometer'

February 2022 Outlook: Heightened Volatility Expected to Continue Through Midterm Elections

In our 2022 Annual Forecast last month we were candid about our less than sanguine outlook for 2022 and that we were expecting a reversion to the mean in annual returns and a decent correction. We shared the many obstacles and hurdles we felt the market would be facing in 2022. First and foremost are the forces of the 4-Year Cycle and the impact the midterm elections have on the market.

Midterm election years are notoriously volatile as the two political ...

Continue Reading →
0

Almanac Update January 2022: Indicator Trifecta Could Reshape 2022

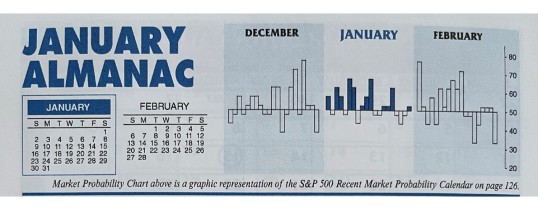
January has quite a reputation on Wall Street as an influx of cash from yearend bonuses and annual allocations has historically propelled stocks higher. January ranks #1 for NASDAQ (since 1971), but fifth on the S&P 500 and DJIA since 1950. January is the last month of the best three-month span and holds a full docket of indicators and seasonalities.

DJIA and S&P rankings did slip from 2000 to 2016 as both indices suffered losses in ten of those seventeen Januarys ...

Continue Reading →
0

2022 Forecast: Early Year High, Worst Six Months Correction & Q4 Rally

As we laid out in our 2021 Forecast Best Case scenario last year Covid-19 vaccines rolled out rather well in 2021 allowing lockdowns and most restrictions to be removed. Additional fiscal stimulus and an extremely accommodative Fed kept the economy humming and the market rallying. Unemployment dove from the early pandemic peak rather precipitously. Leisure, hospitality and travel did not surge per se, but they sure did rebound. The market is on pace to deliver our Best ...

Continue Reading →
0

February 2021 Outlook: Robinhood Thwarts January Indicator Trifecta, Watch Out For February Weakness

It’s been a dynamic six weeks since we made our Annual Forecast for 2021 and volatility spiked the last week of January as the merry Gen Z traders made on run on the shorts of the old guard on Wall Street. Robinhood Markets and other trading apps and services and online communities used by younger up-and-coming retail traders were able to organize en masse and create an old-fashioned short squeeze. You’ve got to hand it to ...

Continue Reading →
0

January 2021 Outlook: Yearend Rally Continues, Seasonal Patterns Endure and 2021 Looks Like A Good Year

Global pandemic was certainly not in our forecast last year and neither was the economic shutdown that came with it. Covid-19 has dramatically changed the world, the economy and the market forever. Some industries are still struggling, while others have adapted and changed. The “stay-at-home” economy stocks, technology in general and biotech industries are having a major impact that has been keeping the economy humming along and the market rallying to new highs.

Our outlook is bullish for next year. Covid ...

Continue Reading →
0

Almanac Update January 2021: An Indicator Trifecta Historically Bullish

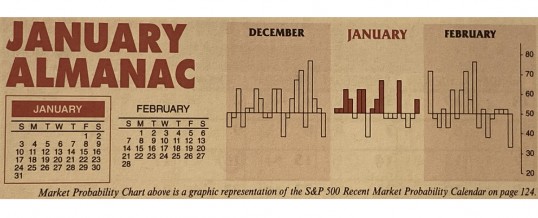
January has quite a reputation on Wall Street as an influx of cash from yearend bonuses and annual allocations has historically propelled stocks higher. January ranks #1 for NASDAQ (since 1971), but fifth on the S&P 500 and sixth for DJIA since 1950. January is the last month of the best three-month span and holds a full docket of indicators and seasonalities.

DJIA and S&P rankings did slip from 2000 to 2016 as both indices suffered losses in ten of those ...

Continue Reading →
0

June 2020 Outlook: Rally Set to Pause at End of Best 8 Months

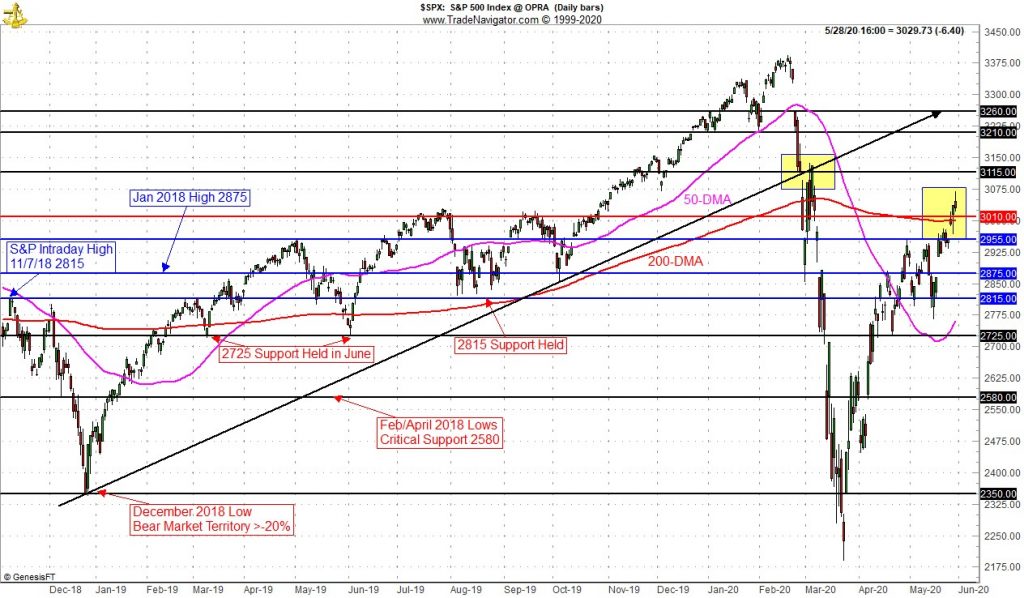
Our Best Six Months Seasonal MACD Sell Signal for DJIA and S&P 500 triggered on May 13 when this recovery rally took a brief pause. The rally then resumed adding to May’s gains and putting NASDAQ back in the black for the year and up 5.8% year-to-date on the close of May. But the market is bumping into some resistance here technically and looks set to pause again and pullback to recent support levels.

Continue Reading →

0

May 2020 Outlook: Down “Best Six Months” Warning Sign

Despite the selloff on the last day of April, the Best Six Months ended on a positive note, registering the best month in decades and the best April since the Great Depression. We have been tracking our Seasonal Best Six Months MACD Sell Signal for DJIA and S&P 500 since April 1. The slower MACD Sell indicator turned positive March 26 and remains in an uptrend and has not issued a new sell signal yet. At this point it would ...

Continue Reading →
0

April 2020 Outlook: Beware the Bear Market Bounce

The Dow’s 6.4% rally on March 26 capped the biggest three-day surge since October 6-8, 1931. That may sound encouraging, but remember 1931 was the worst year for DJIA on record, down 52.7%. DJIA jumped 21.3% from the low on Monday March 23. This surge came on the heels of the fastest and most furious decline in stock market history. DJIA dropped 37.1% from its 2/12/2020 all-time high in 40 calendar days. It fell 35.9% in 31 days from the ...

Continue Reading →
0

March 2020 Outlook: Coronavirus Fears Grip Wall Street

The Dow Jones Industrial Average suffered its worst one-day point loss on February 27. The market was down all day, but fluctuated dramatically with the headlines. Widespread selling pushed the market into correction territory with the Dow down 12.8% from its February 12 all-time high as of the close on February 27. S&P 500 and NASDAQ are down 12.0% and 12.7% from their respective February 19 all-time highs.

At 8 calendars days long (6 trading days), this is the fastest 10% ...

Continue Reading →
0
Page 1 of 2 12