

Global pandemic was certainly not in our forecast last year and neither was the economic shutdown that came with it. Covid-19 has dramatically changed the world, the economy and the market forever. Some industries are still struggling, while others have adapted and changed. The “stay-at-home” economy stocks, technology in general and biotech industries are having a major impact that has been keeping the economy humming along and the market rallying to new highs.
Our outlook is bullish for next year. Covid cases, deaths and hospitalizations are elevated and on the rise, but vaccines are rolling out and much of the economy has learned how to adjust and deal with the restrictions and new socially distant mores. Our big concern is the struggling industries and their workers that are not finding new jobs.
The travel, leisure, hospitality, restaurant and similar service industries are in dire straits. Vast numbers of restaurants and small businesses have closed or gone out of business due to Covid and the level of Jobless Claims and the recent uptick in early December are emblematic of the economy’s struggles.
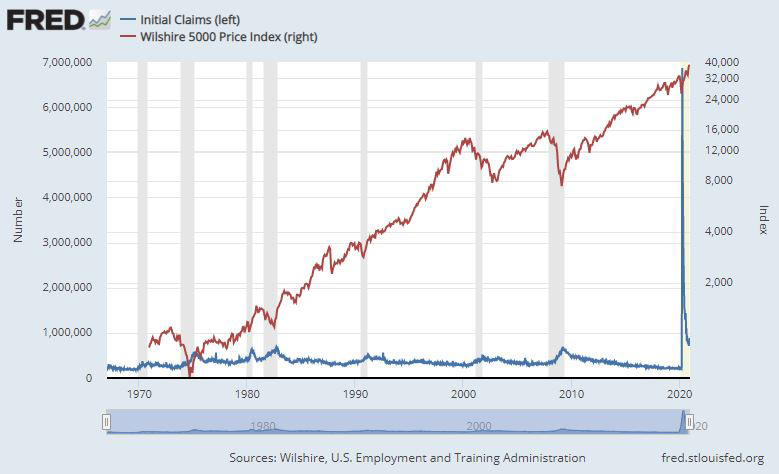
The chart below tells quite a dramatic story. Using the most excellent St. Louis Fed’s FRED database we have charted Initial Weekly Jobless Claims along with the Wilshire 5000 overlaid with the NBER (National Bureau of Economic Research) recession bars. The spike in Claims to nearly 7 million on the right side of the chart when the world shut down in March is astonishing and miles above any previous high. Claims have come down but are still at pre-Covid record levels and this December uptick is concerning. We will need to see major improvement on the jobs front for our Best Case scenario for 2021 to pan out.
Next year is also a post-election year with a new president from a new party. Historically, post-election years have not been great for the market as presidents, new or reelected, make changes early in the term and try to push through the their most disruptive policy initiatives. But post-election years have improved in recent years. Perhaps recent election-year weakness, which can be attributed to more contentious, campaigning of late, has benefitted post-election years.
Control of Congress also hangs in the balance with the outcome of the Georgia Senate runoff on January 5, 2021. If the republicans win they secure control of the Senate, making it harder for President-elect Joe Biden to get through legislation. If the democrats win both seats in Georgia with the two independents that caucus with democrats it will be 50/50 in the Senate making it easier for Biden to implement more new policy and break the gridlock that often limits sweeping change.
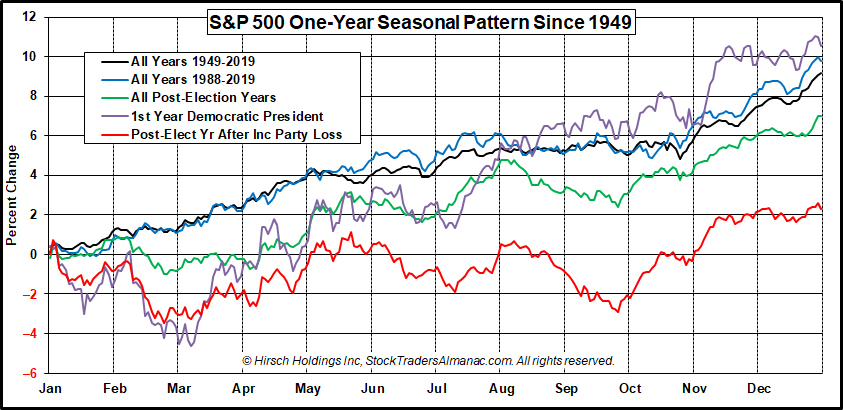
Post-election years after an incumbent party loses the White House have been rather weak, up only 2.3% on average for the S&P 500 since 1949. This is represented in the red line in the chart below of the S&P 500 One-Year Seasonal Pattern Since 1949. This chart also shows the historical seasonal patterns for all years since 1949 and since 1988 as well as all post-election years and the 1st Year of a new democratic president.
Admittedly, there are limited data points for first year democrats with only four. But change in party with a new, first year democratic president came with democratic control of Congress and significantly higher performance for the S&P 500, averaging 10.6% with a median gain of 15.1%. 1977, Jimmy Carter’s first year, was the only negative one down -11.5%. S&P 500 was up 23.1% in 1961, Kennedy’s first year; 7.1% in 1993, Clinton’s first year and 23.5% in 2009, Obama’s first year.
Four Horseman of the Economy
The Dow is our lead horsemen and it along with the rest of the stock market has been logging new highs and tracking seasonal patterns since September. We expect this trend to continue unless the Covid pandemic spirals out of control, the vaccines prove ineffective and/or earnings outlooks deteriorate.
Consumer confidence is still rather glum as folks struggle to navigate and survive the economic disruptions from the pandemic and related restrictions. Travel and leisure struggles reflect this lack of confidence. The Fed can’t get much easier so a retreat in the spread of Covid, vaccine success, a new stimulus package and some light at the end of the tunnel that there will be a resumption of a more normal economy will do much to improve consumers’ outlook.
The Unemployment Rate is still elevated and likely to remain so as jobless claims are still historically high and on the rise. Some vision of a full economic reopening, where folks can get back to work in the hospitality business, travel and freely go out will help companies start to rehire. But it will likely be some time before workers whose businesses closed find new jobs or new fields.
Our inflation horseman as measured by our 6-month exponential moving average calculations on the CPI and PPI have been in retreat since before Covid and the PPI has gone deeper negative since last year. Pent up demand once Covid is in check and the economy reopens should help bring inflation out of the doldrums.
2021 Forecast
• Worst Case – DJIA & S&P 500 up 4-8%. NASDAQ up 6-10% – Covid-19 worsens; earnings outlook slips. Market correction with recovery by year end with modest single digit gains.
• Base Case – DJIA & S&P 500 up 8-12%. NASDAQ up 15-20% – Typical Post-Election year with a new Democrat in the White House.
• Best Case – DJIA & S&P 500 up 15-20%. NASDAQ up 22-27% – Covid-19 vaccine rolls out perfectly, additional fiscal stimulus, leisure, hospitality and travel surges, and unemployment dives.
Happy Holidays & Happy New Year, we wish you all a healthy and prosperous 2021!
DEC
2020