

The Dow’s 6.4% rally on March 26 capped the biggest three-day surge since October 6-8, 1931. That may sound encouraging, but remember 1931 was the worst year for DJIA on record, down 52.7%. DJIA jumped 21.3% from the low on Monday March 23. This surge came on the heels of the fastest and most furious decline in stock market history. DJIA dropped 37.1% from its 2/12/2020 all-time high in 40 calendar days. It fell 35.9% in 31 days from the top of the waterfall decline on 2/21/2020 and 31.4% in 19 days from the 6.6% three-day rally March 2-4, 2020.
While we are all rooting for the market to find support here so much damage has been done. A great deal of uncertainty remains for the economy and health crisis. This looks like a bear market bounce.
Federal Reserve and Federal Government action has been more encouraging. The Fed has made it clear that it will supply unlimited liquidity to the financial system. Congress and the President have now put into law this $2 trillion emergency stimulus package – and more is likely. There are also some encouraging therapeutic solutions, but nothing of substance yet. And the lockdown of much of the country has yet to stem the spread of COVID-19 in the U.S.
History suggests that we are in for some tough sledding in the market this year with quite a bit of chop. When the January Barometer came in with a negative reading our outlook for 2020 began to diminish as every down January since 1950 has been followed by a new or continuing bear market, a 10% correction or a flat year. Then another warning sign flashed when DJIA closed below its December closing low on February 26, 2020 as the impact of this novel coronavirus began to take its toll on Wall Street.
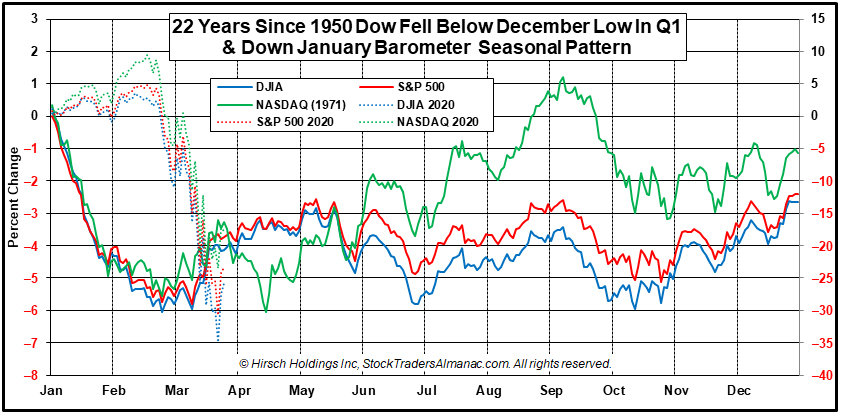
In the March Outlook we presented this graph of the composite seasonal pattern for the 22 years since 1950 when both the January Barometer as measured by the S&P 500 were down and the Dow closed below its previous December closing low in the first quarter. Below we have added DJIA, S&P 500 and NASDAQ Composite for 2020 year-to-date as of the close on March 25. Comparing 2020 market action to these 22 years, suggests a choppy year ahead with the potential for several tests of the recent low.
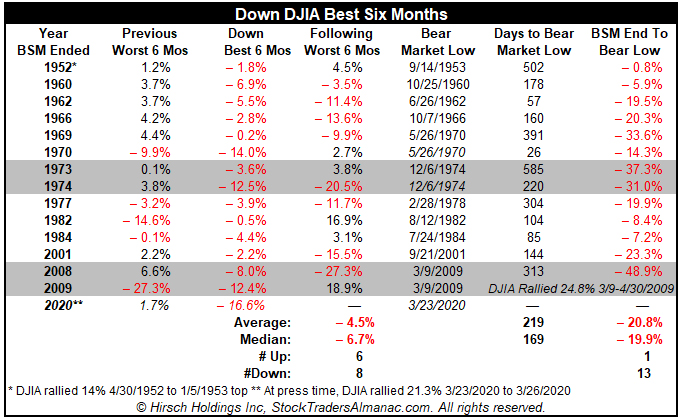
The depth of this waterfall decline may be too deep for the market to rebound quickly. This bear market also put this year’s Best Six Months (November-April) at risk of being negative. The record of down Best Six Months is not encouraging and it reminds us of a salient quote out of the Almanac quote database from an old market sage, “If the market does not rally, as it should during bullish seasonal periods, it is a sign that other forces are stronger and that when the seasonal period ends those forces will really have their say.”— Edson Gould (Stock market analyst, Findings & Forecasts, 1902-1987)
The table below of Down Best Six Months for DJIA since 1950 also suggests caution and patience is in order. Subsequent Worst Six Months (May-October) have averaged losses with only two decent years: 1982 and 2009. The market bottom in August 1982 marked the end of the 1966-1982 secular bear market and came after the early 1980s double dip recession. Following the first back-to-back down Best Six Months since 1973-1974, the market hit a secular bear market low in March 2009. Market action in the rest of these years was rather grim.
This is a generational crisis that will forever change our lives. But the market and our strategy have been through these trials and tribulations before. Market conditions are expected to improve in the near future. Continue to stick to the system and remain rational.
Historic Daily Moves, Historic Market Times
DJIA’s 11.4% gain on Tuesday March 24 was of historic proportions – the best gain since 1933. Ironically, that record DJIA gain of 15.3% was achieved in the month of March and on the Ides of March, 3/15/1933 to be precise. Take a look at page 164 of the Stock Trader’s Almanac 2020 and you will a see a few other gains of similar magnitude from other historic market times: 1929, 1931, 1932, 1987 and 2008. This sort of behavior is not characteristic of a healthy environment for stocks.
Moves of this magnitude in either direction have become a rather regular occurrence these past few weeks. One could argue that market volatility has been on the rise since the repeal of the Glass–Steagall Act of 1932 which separated commercial banking from investment banking. Electronic trading has accelerated the increase and frequency of large daily swings.
We have never before experienced the frequency and magnitude of the daily market moves we’ve had since the last week of February 2020. Over the past 24 trading days starting on February 24 DJIA has logged 7 gains of 3% or more, 11 losses of -3% or more; 7 gains of 4% or more, 7 losses of -4% or more; and 5 gains of 5% or more, 5 losses of -5% or more. This has never occurred before.
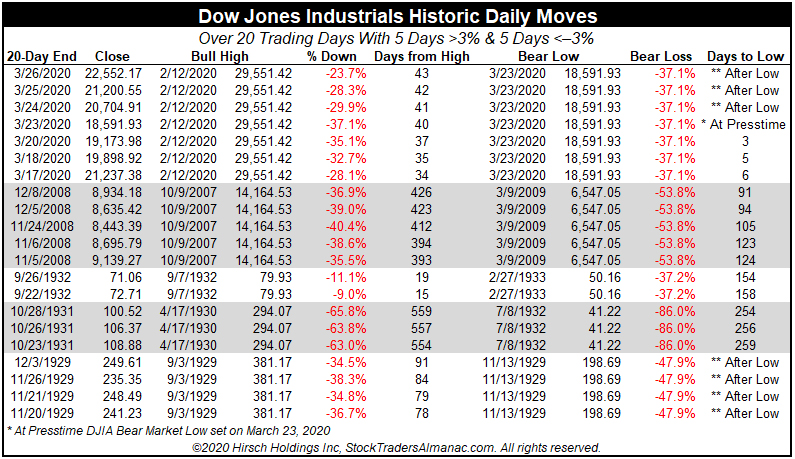
In order to put the current market into some historical perspective we compiled the accompanying table of previous times DJIA has logged 5 days with gains of 3% more and 5 days with losses of -3% or more over 20 trading days. It’s not a long list: November-December 2008, September 1932, October 1931 and November-December 1929. Not the best company to keep.
So while the snapback rally is welcome and encouraging, volatility remains high and daily moves of this frequency and magnitude in both directions have occurred during major market declines. Record gains like March 24 are not necessarily an indication that we have seen the low. It is constructive, but not a foregone conclusion. Stay safe and be well out there.
APR
2020