Posts Tagged 'Worst Four Months'

Almanac Update December 2021: Small Cap Effect & Santa Claus Rally

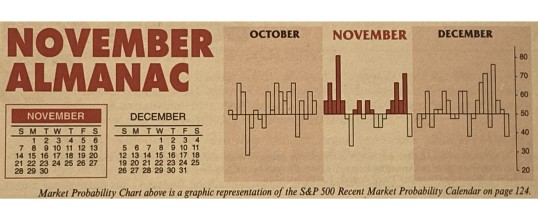
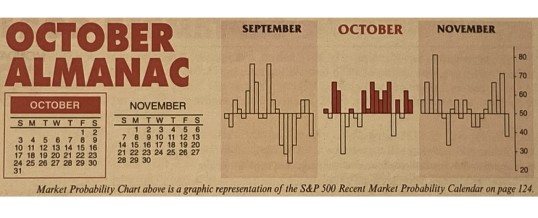
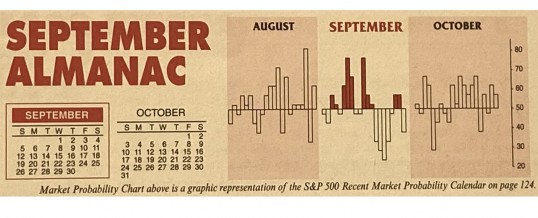
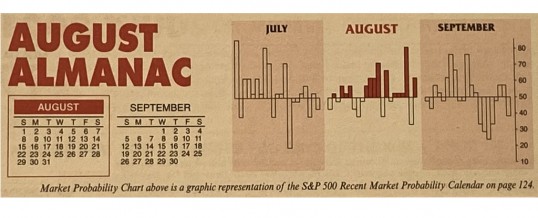
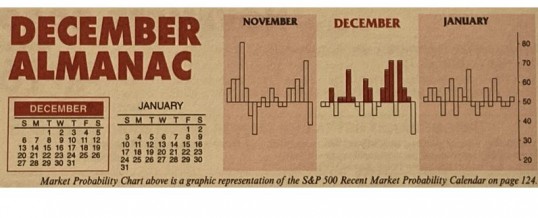
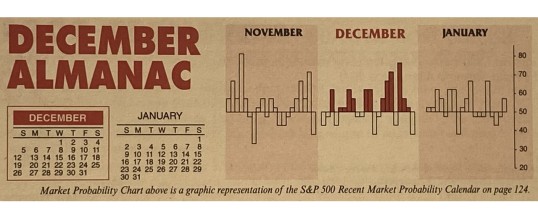
December is the number three S&P 500 and Dow Jones Industrials month since 1950, averaging gains of 1.5% on each index. It’s the second-best Russell 2000 (1979) month and third best for NASDAQ (1971). In 2018, DJIA suffered its worst December performance since 1931 and its fourth worst December going all the way back to 1901. However, the market rarely falls precipitously in December and a repeat of 2018 is not all that likely. When December is down it is ...

Continue Reading →
0

Almanac Update November 2021: Best Consecutive Three-Month Span Begins

November maintains its status among the top performing months as fourth-quarter cash inflows from institutions drive November to lead the best consecutive three-month span November-January. However, the month has taken hits during bear markets and November 2000, down –22.9% (undecided election and a nascent bear), was NASDAQ’s second worst month on record—only October 1987 was worse.

November begins the “Best Six Months” for the DJIA and S&P 500, and the “Best Eight Months” for NASDAQ. Small caps come into favor during ...

Continue Reading →
0

Almanac Update October 2021: Resist “Octoberphobia”

October often evokes fear on Wall Street as memories are stirred of crashes in 1929, 1987, the 554-point drop on October 27, 1997, back-to-back massacres in 1978 and 1979, Friday the 13th in 1989 and the 733-point drop on October 15, 2008. During the week ending October 10, 2008, Dow lost 1,874.19 points (18.2%), the worst weekly decline in our database going back to 1901, in percentage terms. March 2020 now holds the dubious honor of producing the worst and ...

Continue Reading →
0

Almanac Update September 2021: Worst Month of Year Over Last 71 Years

Start of the business year, end of summer vacations, and back to school once made September a leading barometer month in the first 60 years of 20th century, now portfolio managers back after Labor Day tend to clean house. Since 1950, September is the worst performing month of the year for DJIA, S&P 500, NASDAQ (since 1971), Russell 1000 and Russell 2000 (since 1979). After four solid years from 1995-1998 during the dot.com bubble buildup, S&P 500 was down five ...

Continue Reading →
0

Almanac Update August 2021: Challenging Month in Post-Election Years

Money flows from harvesting made August a great stock market month in the first half of the Twentieth Century. It was the best month from 1901 to 1951. In 1900, 37.5% of the population was farming. Now that less than 2% farm, August is amongst the worst months of the year. It is the worst DJIA, S&P 500, and Russell 2000 month over the last 33 years, 1988-2020 with average declines ranging from 0.4% by Russell 2000 to 0.8% by ...

Continue Reading →
0

Almanac Update July 2021: Best Month of Post-Election Years

July historically is the best performing month of the third quarter however, the mostly negative results in August and September tend to make the comparison easy. Two “hot” Julys in 2009 and 2010 where DJIA and S&P 500 both gained greater than 6% and strong performances in 2013 and 2018 have boosted July’s average gains since 1950 to 1.3% and 1.1% respectively. Such strength inevitability stirs talk of a “summer rally”, but beware the hype, as it has historically been ...

Continue Reading →
0

Almanac Update June 2021: Second Worst DJIA Month in Post-Election Years

June has shone brighter on NASDAQ stocks over the last 50 years as a rule ranking sixth with a 0.9% average gain, up 28 of 50 years. This contributes to NASDAQ’s “Best Eight Months” which ends in June. June ranks near the bottom on the Dow Jones Industrials just above September since 1950 with an average loss of 0.2%. S&P 500 performs similarly poorly, ranking ninth, but essentially flat (0.1% average gain). Small caps also tend to fare well in ...

Continue Reading →
0

Almanac Update January 2021: An Indicator Trifecta Historically Bullish

January has quite a reputation on Wall Street as an influx of cash from yearend bonuses and annual allocations has historically propelled stocks higher. January ranks #1 for NASDAQ (since 1971), but fifth on the S&P 500 and sixth for DJIA since 1950. January is the last month of the best three-month span and holds a full docket of indicators and seasonalities.

DJIA and S&P rankings did slip from 2000 to 2016 as both indices suffered losses in ten of those ...

Continue Reading →
0

Almanac Update December 2020: Small Caps Shine and Santa Visits Wall Street

December is now the number three S&P 500 and Dow Jones Industrials month since 1950, averaging gains of 1.5% on each index. It’s the top Russell 2000 (1979) month and third best for NASDAQ (1971). In 2018, DJIA suffered its worst December performance since 1931 and its fourth worst December going all the way back to 1901. However, the market rarely falls precipitously in December and a repeat of 2018 is not highly likely. When December is down it is ...

Continue Reading →
0

Almanac Update November 2020: Top S&P 500 and DJIA Month in Election Years

November is still maintaining its status among the top performing months as fourth-quarter cash inflows from institutions drive November to lead the best consecutive three-month span November-January. However, the month has taken hits during bear markets and November 2000, down –22.9% (undecided election and a nascent bear), was NASDAQ’s second worst month on record—only October 1987 was worse.

November begins the “Best Six Months” for the DJIA and S&P 500, and the “Best Eight Months” for NASDAQ. Small caps come into ...

Continue Reading →
0
Page 1 of 2 12