Posts Tagged 'First Day'

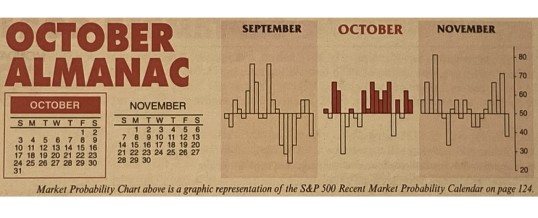
Almanac Update October 2021: Resist “Octoberphobia”

October often evokes fear on Wall Street as memories are stirred of crashes in 1929, 1987, the 554-point drop on October 27, 1997, back-to-back massacres in 1978 and 1979, Friday the 13th in 1989 and the 733-point drop on October 15, 2008. During the week ending October 10, 2008, Dow lost 1,874.19 points (18.2%), the worst weekly decline in our database going back to 1901, in percentage terms. March 2020 now holds the dubious honor of producing the worst and ...

Continue Reading →
0

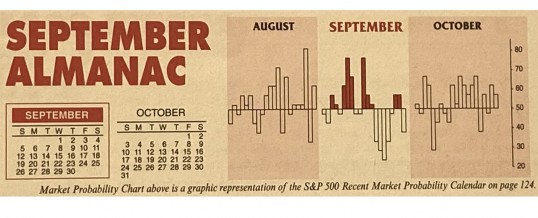
Almanac Update September 2021: Worst Month of Year Over Last 71 Years

Start of the business year, end of summer vacations, and back to school once made September a leading barometer month in the first 60 years of 20th century, now portfolio managers back after Labor Day tend to clean house. Since 1950, September is the worst performing month of the year for DJIA, S&P 500, NASDAQ (since 1971), Russell 1000 and Russell 2000 (since 1979). After four solid years from 1995-1998 during the dot.com bubble buildup, S&P 500 was down five ...

Continue Reading →
0

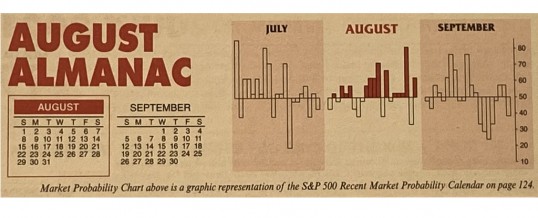
Almanac Update August 2021: Challenging Month in Post-Election Years

Money flows from harvesting made August a great stock market month in the first half of the Twentieth Century. It was the best month from 1901 to 1951. In 1900, 37.5% of the population was farming. Now that less than 2% farm, August is amongst the worst months of the year. It is the worst DJIA, S&P 500, and Russell 2000 month over the last 33 years, 1988-2020 with average declines ranging from 0.4% by Russell 2000 to 0.8% by ...

Continue Reading →
0

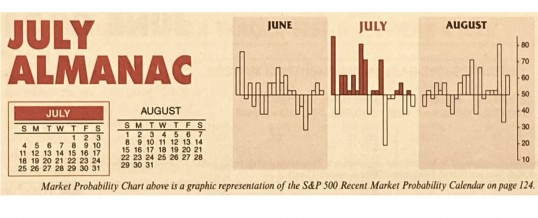
Almanac Update July 2021: Best Month of Post-Election Years

July historically is the best performing month of the third quarter however, the mostly negative results in August and September tend to make the comparison easy. Two “hot” Julys in 2009 and 2010 where DJIA and S&P 500 both gained greater than 6% and strong performances in 2013 and 2018 have boosted July’s average gains since 1950 to 1.3% and 1.1% respectively. Such strength inevitability stirs talk of a “summer rally”, but beware the hype, as it has historically been ...

Continue Reading →
0

Almanac Update June 2021: Second Worst DJIA Month in Post-Election Years

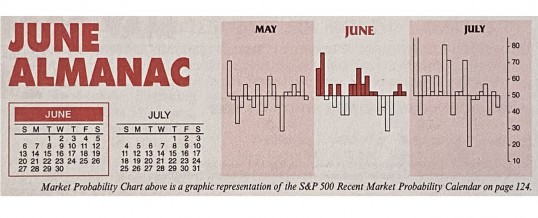
June has shone brighter on NASDAQ stocks over the last 50 years as a rule ranking sixth with a 0.9% average gain, up 28 of 50 years. This contributes to NASDAQ’s “Best Eight Months” which ends in June. June ranks near the bottom on the Dow Jones Industrials just above September since 1950 with an average loss of 0.2%. S&P 500 performs similarly poorly, ranking ninth, but essentially flat (0.1% average gain). Small caps also tend to fare well in ...

Continue Reading →
0

Almanac Update May 2021: Stronger in Post-Election Years

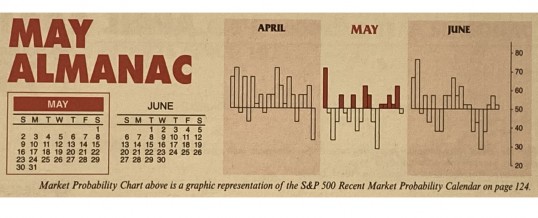
May officially marks the beginning of the “Worst Six Months” for the DJIA and S&P. To wit: “Sell in May and go away.” Our “Best Six Months Switching Strategy,” created in 1986, proves that there is merit to this old trader’s tale. A hypothetical $10,000 investment in the DJIA compounded to a gain of $960,943 for November-April in 70 years compared to just $1,656 for May-October. The same hypothetical $10,000 investment in the S&P 500 compounded to $788,997 for November-April ...

Continue Reading →
0

Almanac Update April 2021: Top DJIA Month – Up 15 in a Row

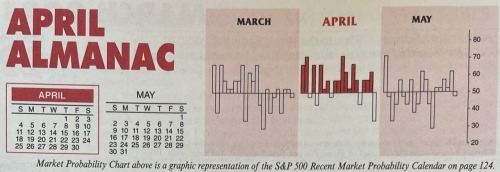
April marks the end of the “Best Six Months” for DJIA and the S&P 500. The window for our seasonal MACD sell signal opens on April 1st. From our Seasonal MACD Buy Signal on November 5, 2020 through the close on March 25, 2021, DJIA was up 14.9% and S&P 500 had advanced 11.4%. These above average gains are encouraging and suggest seasonality is back on track after getting derailed by Covid-19 last year.

April 1999 was the first month to ...

Continue Reading →
0