Posts Tagged 'Octoberphobia'

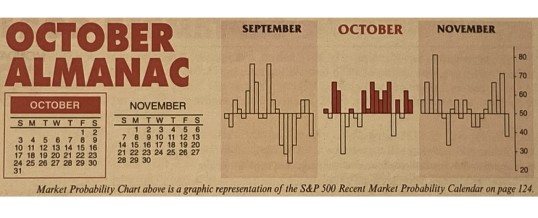
Almanac Update October 2021: Resist “Octoberphobia”

October often evokes fear on Wall Street as memories are stirred of crashes in 1929, 1987, the 554-point drop on October 27, 1997, back-to-back massacres in 1978 and 1979, Friday the 13th in 1989 and the 733-point drop on October 15, 2008. During the week ending October 10, 2008, Dow lost 1,874.19 points (18.2%), the worst weekly decline in our database going back to 1901, in percentage terms. March 2020 now holds the dubious honor of producing the worst and ...

Continue Reading →
0

Market Outlook October 2019: Octoberphobia Sets Up Best Six Months

Amid all the news and noise U.S. financial markets continue to track the seasonal and 4-year election cycle patterns closely as they has all year long. Our strategy that employs and utilizes seasonality is outperforming the market.

Amazingly, 2019 market price action continues to track the historical trend and pattern as you can see in the updated chart of Pre-Election Year Seasonal Patterns overlaid with 2019. On cue stocks paused at resistance below the highs in the third week of ...

Continue Reading →
0

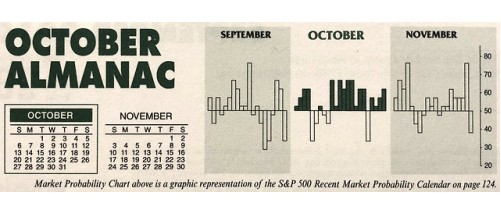
Almanac Update October 2019: Second Worst Month in Pre-Election Years

October often evokes fear on Wall Street as memories are stirred of crashes in 1929, 1987, the 554-point drop on October 27, 1997, back-to-back massacres in 1978 and 1979, Friday the 13th in 1989 and the 733-point drop on October 15, 2008. During the week ending October 10, 2008, Dow lost 1,874.19 points (18.2%), the worst weekly decline in our database going back to 1901, in point and percentage terms. The term “Octoberphobia” has been used to describe the phenomenon ...

Continue Reading →
0

So “Sell in May” Didn’t Work This Year?

Not so fast. The answer is: We don’t know yet, the Worst Six Months (WSM) are not over yet. People forget that Sell in May is NOT the whole seasonality. Our Best and Worst Months Tactical Switching Strategies are based on the Dow’s and S&P’s Best Six Months (BSM) from November through April and the Worst Six Months from May through October, and NASDAQ’s Best Eight Months (B8M) from November through June and the Worst Four Months (W4M) from July ...

Continue Reading →
0