
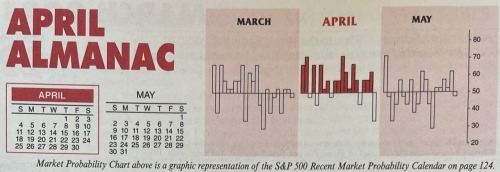
April marks the end of the “Best Six Months” for DJIA and the S&P 500. The window for our seasonal MACD sell signal opens on April 1st. From our Seasonal MACD Buy Signal on November 5, 2020 through the close on March 25, 2021, DJIA was up 14.9% and S&P 500 had advanced 11.4%. These above average gains are encouraging and suggest seasonality is back on track after getting derailed by Covid-19 last year.
April 1999 was the first month to gain 1000 DJIA points. However, from 2000 to 2005, “Tax” month was hit, declining in four of six years. Since 2006, April has been up fifteen years in a row with an average gain of 2.9% to reclaim its position as the best DJIA month since 1950. April is second best for S&P and fourth best for NASDAQ (since 1971).
The first trading day of April and the second quarter, has enjoyed notable strength over the past 26 years, advancing 18 times with an average gain of 0.27% in all 26 years for DJIA. However, five of the eight declines have occurred in the last eight years. The largest decline was last year when DJIA declined 4.44% (973.65 points). Other declines were in 2001, 2002 and 2005. S&P 500’s record on April’s first trading day matches DJIA, 18 advances in 26 years. NASDAQ recent performance is slightly weaker than DJIA and S&P 500, but the day is still bullish for technology stocks in general with more advances than declines during the same period.
The first half of April used to outperform the second half, but since 1994 that has no longer been the case. The effect of April 15 Tax Deadline (moved to May 17 for 2021) appears to be diminished with numerous bullish days present on either side of the day. Traders and investors are clearly focused on first quarter earnings and guidance during April. This year, guidance is likely to be the greatest focus as the economy continues to reopen. Traders and investors will likely be looking for signs that “work-from-home” stocks can continue to grow and signs that leisure, hospitality, and travel are rebounding.
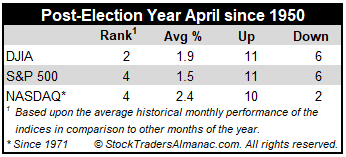
Typical post-election year blues have done little to damper April’s performance since 1953. April is DJIA’s second best month in post-election years, gaining 1.9% on average. April is fourth best for S&P 500 and NASDAQ. Although post-election year 2005 did suffer a 3% DJIA decline.
Good Friday (and Easter) lands at the beginning of April this year. Historically the longer-term track record of Good Friday (page 98 of STA 2021) is bullish with notable average gains by DJIA, S&P 500, NASDAQ and Russell 2000 on the trading day before. NASDAQ has advanced 19 of the last 20 days before Good Friday. Monday, the day after Easter has exactly the opposite record since 1980 and is in the running for the worst day after of any holiday. Since 2004 the day after has been improving with S&P 500 up 11 of the last 17.

MAR
2021