
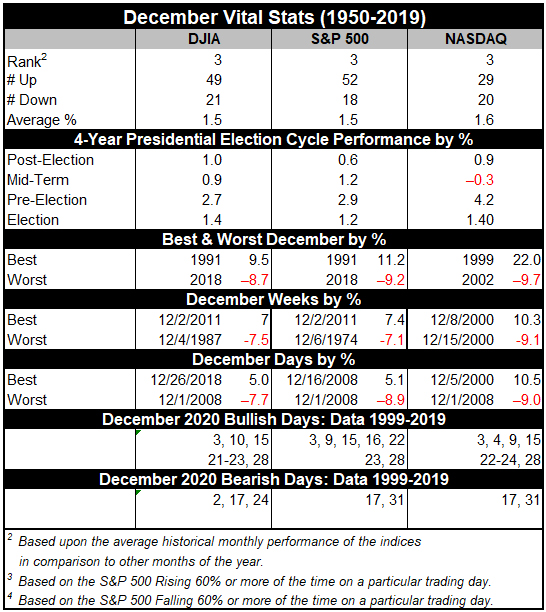
December is now the number three S&P 500 and Dow Jones Industrials month since 1950, averaging gains of 1.5% on each index. It’s the top Russell 2000 (1979) month and third best for NASDAQ (1971). In 2018, DJIA suffered its worst December performance since 1931 and its fourth worst December going all the way back to 1901. However, the market rarely falls precipitously in December and a repeat of 2018 is not highly likely. When December is down it is usually a turning point in the market—near a top or bottom. If the market has experienced fantastic gains leading up to December, stocks can pullback in the first half of the month.
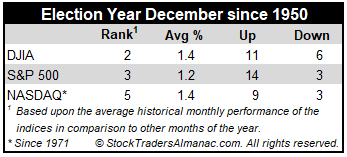
In the last seventeen election years, December’s ranking changed modestly to #2 DJIA, #5 NASDAQ, but S&P 500 remains #3. Small caps, measured by the Russell 2000, have had a field day in election-year Decembers. Since 1980, the Russell 2000 has lost ground just once in ten election years in December. The average small cap gain in all ten years is a solid 3.0%. The Russell 2000’s single loss was in 1980 when the Prime Rate was 21.5%.
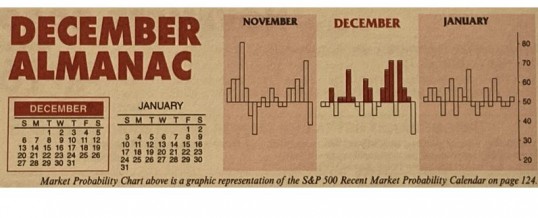
Trading in December is holiday inspired and fueled by a buying bias throughout the month. However, the first part of the month tends to be weaker as tax-loss selling and yearend portfolio restructuring begins. Regardless, December is laden with market seasonality and important events.
Small caps tend to start to outperform larger caps near the middle of the month (early January Effect) and the “Santa Claus Rally” begins on the open on Christmas Eve day and lasts until the second trading day of 2021. Average S&P 500 gains over this seven trading-day range since 1969 are a respectable 1.3%.
This is our first indicator for the market in the New Year. Years when the Santa Claus Rally (SCR) has failed to materialize are often flat or down. The last six times SCR (the last five trading days of the year and the first two trading days of the New Year) has not occurred were followed by three flat years (1994, 2004 and 2015) and two nasty bear markets (2000 and 2008) and a mild bear that ended in February 2016. As Yale Hirsch’s now famous line states, “If Santa Claus should fail to call, bears may come to Broad and Wall.”
December Triple Witching Week is more favorable to the S&P 500 with Monday up twelve of the last twenty years while Triple-Witching Friday is up twenty-six of the last thirty-eight years with an average 0.26% gain. The entire week has logged gains twenty-seven times in the last thirty-six years. The week after December Triple Witching is the best of all weeks after Triple Witching for DJIA and is the only one with a clearly bullish bias, advancing in twenty-eight of the last thirty-eight years. Small caps shine especially bright with a string of bullish days that runs from December 18 to 24.
Trading the day before and the day after Christmas is generally bullish across the board with the greatest gains coming from the day before (DJIA up eight of the last thirteen). On the last trading day of the year, NASDAQ has been down in fifteen of the last twenty years after having been up twenty-nine years in a row from 1971 to 1999. DJIA, S&P 500, and Russell 1000 have also been struggling recently and exhibit a bearish bias over the last twenty-one years. Russell 2000’s record very closely resembles NASDAQ, gains every year from 1979 to 1999 and only six advances since.
DEC
2020