
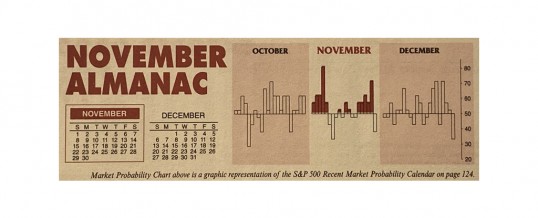
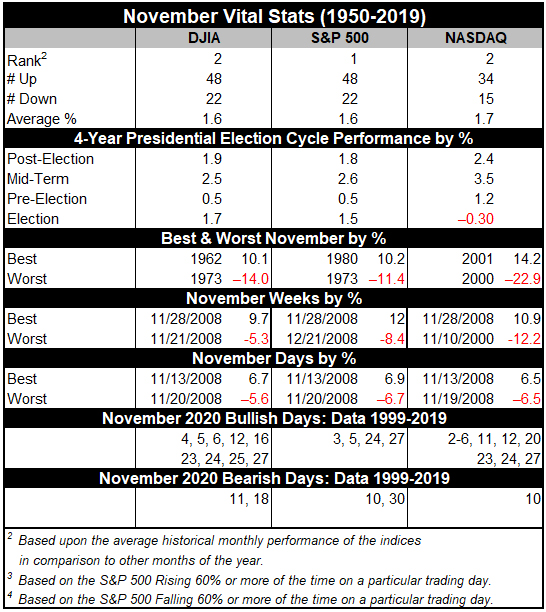
November is still maintaining its status among the top performing months as fourth-quarter cash inflows from institutions drive November to lead the best consecutive three-month span November-January. However, the month has taken hits during bear markets and November 2000, down –22.9% (undecided election and a nascent bear), was NASDAQ’s second worst month on record—only October 1987 was worse.
November begins the “Best Six Months” for the DJIA and S&P 500, and the “Best Eight Months” for NASDAQ. Small caps come into favor during November, but don’t really take off until the last two weeks of the year. November is the number-two DJIA (since 1950), NASDAQ (since 1971) and Russell 2000 (since 1979) month. November is best for S&P 500 (since 1950).
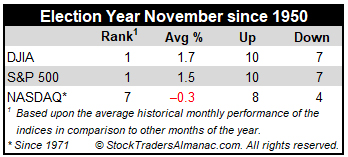
November’s is a mixed bag in presidential election years. DJIA has advanced in 10 of the last 17 election years since 1952 with an average gain of 1.7%. Significant DJIA declines occurred in 2008 (-5.3%) and 2000 (-5.1%). For S&P 500 November ranks best with a similar record to DJIA. NASDAQ and Russell 2000 are not as strong ranking #7 and #6 respectively. Fewer years of data (12 for NASDAQ and 10 for Russell indices) combined with sizable losses in 2000 and 2008 drag down rankings and average gains when compared to DJIA and S&P 500.
Options expiration often coincides with the week before Thanksgiving as it does this year. DJIA posted ten straight gains 1993-2002 and has been up 20 of the last 27 weeks before Thanksgiving. The Monday of expiration week has been streaky, but the net result since 1994 is 16 DJIA gains in 26 years with 11 advances occurring in the last 16 years. Options expiration day has a clearly bullish bias, up 14 of the last 18. The week after expiration has been a mixed bag recently. DJIA has been up five of the last eight after being down five of six from 2006 to 2011.
Being a bullish month November has four bullish days, though it does have weak points. NASDAQ and Russell 2000 exhibit the greatest strength at the beginning and end of November. Historically, Russell 2000 is notably bearish on the 12th trading day of the month; the small-cap benchmark has risen just eight times in the last 36 years (since 1984). The Russell 2000’s average decline is 0.39% on the day. Recent weakness around Thanksgiving has shifted DJIA and S&P 500 strength to mirror that of NASDAQ and Russell 2000 with the majority of bullish days at the beginning and end of the month. We believe the best way to trade Thanksgiving is to go long into weakness the week before the holiday and exit into strength just before or after.
NOV
2020