Posts Tagged 'January Barometer'

January Barometer: January Trifecta Spoiled by Coronavirus

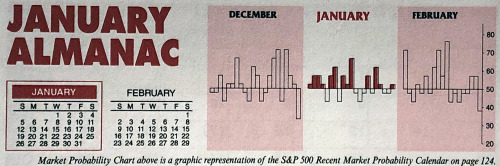
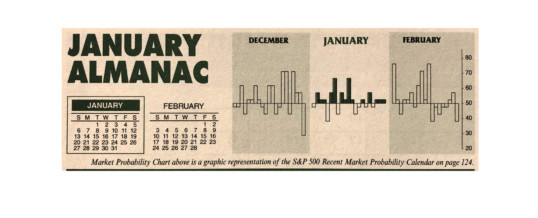
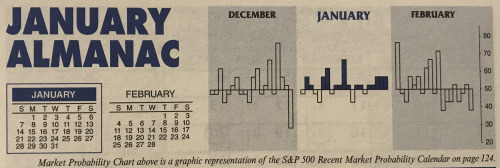
The market decline on the last day of January spoiled what would have been the fourth consecutive January Trifecta. S&P 500 finished January down 0.2% and thus the January Barometer is negative.

Devised by Yale Hirsch in 1972, the January Barometer has registered ten major errors since 1950 for an 85.7% accuracy ratio. This indicator adheres to propensity that as the S&P 500 goes in January, so goes the year. Of the ten major errors Vietnam affected 1966 and 1968. 1982 ...

Continue Reading →
0

Market Outlook January 2020: Market Sanguine on Impeachment & Sitting President Running

The House of Representatives impeached President Trump December 18, but is holding off sending the articles of impeachment to the Senate until they define the rules of engagement for the Senate trial. Meanwhile the stock market rallied to new all-time highs across the board. Senate republican leadership has made it clear they are not on a trajectory to remove the president from office. The market remains sanguine as the likelihood of the president’s removal from office appears low. So we ...

Continue Reading →
0

Almanac Update January 2020: Not as Strong in Election Years

January has quite a reputation on Wall Street as an influx of cash from yearend bonuses and annual allocations typically propels stocks higher. January ranks #1 for NASDAQ (since 1971), but fifth on the S&P 500 and sixth for DJIA since 1950. It is the end of the best three-month span and holds a full docket of indicators and seasonalities.

DJIA and S&P rankings did slip from 2000 to 2016 as both indices suffered losses in ten of those seventeen ...

Continue Reading →
0

Market Outlook April 2019: End Q1 Consolidation Resolves Higher In April

April is the last month of DJIA’s and S&P 500’s “Best Six Months” of the year. As you can see in the accompanying chart of the “Pre-Election Year Seasonal Patterns” the major U.S. stock market indices have historically rallied quite sharply through April. Then DJIA in black and S&P 500 in green historically begin to move sideways at the beginning of the “Worst Six Months” (Sell in May) in May and June while NASDAQ in blue continues to run higher ...

Continue Reading →
0

January Barometer: Trifecta Up 3-For-3 Bullish for 2019

S&P 500 finished the month strong with a 7.9% gain. This is the best S&P January since 1987. This is also the third January Trifecta in a row. Last year the S&P 500 crumbled in the fourth quarter under the weight of triple threats from a hawkish and confusing Fed, a newly divided Congress and the U.S. trade battle with China, finishing in the red. 2017’s Trifecta was followed by a full-year gain of 19.4%, including a February-December gain of ...

Continue Reading →
0

Market Outlook January 2019 & Annual Forecast: Santa on Notice from Dueling Grinches – Low Nears – Bear Lurks

Fed Chairman Powell and President Trump have been competing for who can freak the market out most. Our contention for months has been that the Fed is the biggest risk to the market and economy and that surely seems to have come home to roost the past few months and this week.

Last month in our “Market at a Glance” we said that, “After nearly a decade at zero, a brief pause to evaluate the impact of recent hikes does not ...

Continue Reading →
0

Almanac Update January 2019: Top Month for Stocks in Pre-Election Years

January has quite a legendary reputation on Wall Street as an influx of cash from yearend bonuses and annual allocations typically propels stocks higher. January ranks #1 for NASDAQ (since 1971), but sixth on the S&P 500 and DJIA since 1950. It is the end of the best three-month span and holds a full docket of indicators and seasonalities.

DJIA and S&P rankings did slip from 2000 to 2018 as both indices suffered losses in ten of those nineteen Januarys with ...

Continue Reading →
0

Almanac Update January 2018: Results from Trio of Indicators Could Reshape 2018

January has quite a legendary reputation on Wall Street as an influx of cash from yearend bonuses and annual allocations typically propels stocks higher. January ranks #1 for NASDAQ (since 1971), but sixth on the S&P 500 and DJIA since 1950. It is the end of the best three-month span and possesses a full docket of indicators and seasonalities.

In midterm years, January ranks near the bottom since 1950. Large-caps have been the worst with S&P 500 and Russell 1000 ranking ...

Continue Reading →
0
Page 2 of 2 12