
As we laid out in our 2021 Forecast Best Case scenario last year Covid-19 vaccines rolled out rather well in 2021 allowing lockdowns and most restrictions to be removed. Additional fiscal stimulus and an extremely accommodative Fed kept the economy humming and the market rallying. Unemployment dove from the early pandemic peak rather precipitously. Leisure, hospitality and travel did not surge per se, but they sure did rebound. The market is on pace to deliver our Best Case scenarios for 2021. With three trading days left in 2021 DJIA is up 18.9% year-to-date, S&P 500 is up 27.4% and NASDAQ is up 22.5%.
Omicron, inflation and the Fed’s tapering of its accommodative asset purchase program have been giving the market jitters the past few months and creating some volatility. At the last FOMC meeting the Fed came clean on inflation being more persistent, but they also remained rather dovish, reiterating their measured pace of tapering asset purchases and patience with raising rates. This flexibility and reassurance that they are keen on curtailing rampant inflation while remaining supportive of the tentative economic outlook in the face of the enduring pandemic was bullish for Wall Street.
We anticipate the results of the Santa Claus Rally to help solidify our outlook for next year. The Santa Claus Rally was defined by Yale Hirsch in 1972 as the last five trading days of the year and the first two trading days of the New Year. S&P 500 averages 1.3% over the 7-day period, but the real importance of the SCR is as our first seasonal indicator of the year ahead. As the late, great Yale Hirsch’s famous line states, “If Santa Claus should fail to call, bears may come to Broad and Wall.”
The market faces several obstacles for next year. Valuations are rich and year-over-year economic and corporate comparisons will be nowhere near as easy as 2021 versus the 2020 pandemic numbers. While the Fed has promised patience and a slow pace it is now rather clear that they will be making a concerted effort to remove quantitative easing by mid-year and begin slowly raising rates.
This punchbowl of free money sloshing around and the past decade or ZIRP (zero interest rate policy) has been feeding the bull and allowing valuations to get historically high. When the Fed Kool-Aid is gone the party is likely to quiet down. We are not expecting anything sinister or a deep nasty bear market, but a reversion to the mean and a decent correction cannot be ruled out. Market internals and technicals are also concerning as NASDAQ and Russell 2000 have failed to break out to new highs since the beginning of November.
There are also some geopolitical concerns as Russia masses troops on the Ukrainian border, basically challenging NATO and the U.S. Meanwhile China continues to stiff-arm the U.S. on many fronts. Putin and Xi Jinping exuded solidarity in their video summit. Iran and North Korea continue building their nuclear capacity and foment hostility.
But imminent pressure on the market is most likely to come from Washington as is often the case in the battleground that is the midterm election year. President Biden’s approval rating has plummeted since the botched withdrawal from Afghanistan and many are not pleased with how he is handling international affairs and are opposed to Covid mandates. All this has hardened Republican opposition and is likely to boost their resolve and support in the midterm elections. And that is what makes midterm years a bottom picker’s paradise.
Midterm election years are usually a volatile year for stocks as Republicans and Democrats vie for control for Congress, especially under new presidents. Incumbent presidents usually lose seats in the House of Representatives (see 2022 STA page 28) and with the razor thin margins Dems have in both the House and Senate they could easily give up control of Congress in the midterms.
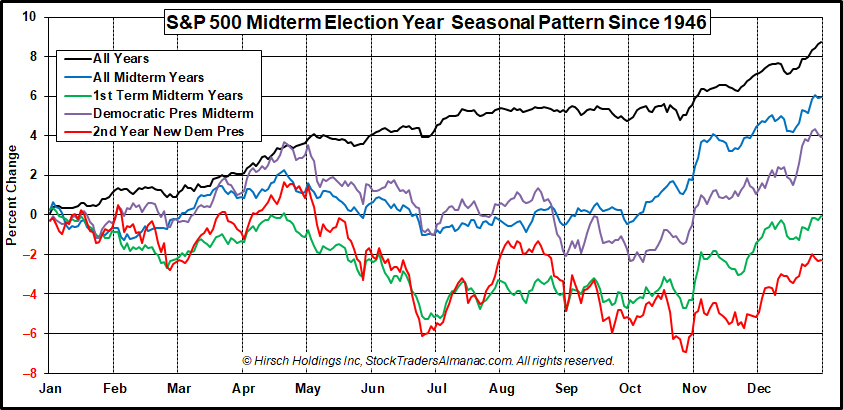
The chart here of the “S&P 500 Midterm Election Year Seasonal Pattern Since 1946” does not paint a rosy picture for 2022. Along with the pattern for all years and all midterm years since WWII we have overlaid the patterns for 1st term midterm years, Democratic president midterm years as well as the 2nd year of new Democratic presidents.
All midterm years average an S&P 500 gain of about 6%, Democratic president midterm years average about 4%, but 1st term midterm years average a loss of -0.6% and the 2nd year of new democratic presidents have been down -2.3% on average. All four tend to hit an early year high in April at the end of the Best Six Months with a low point during the Worst Six Months May-October.
Four Horseman of the Economy
Up until recently our lead horsemen DJIA along with S&P 500 and NASDAQ have been steadily making new highs, but we are seeing a few chinks in the armor as DJIA may be beginning to flatten. The major averages are likely to notch more new highs before they submit to the usual midterm year correction as market internals indicate some broader market weakness.
Consumer spending and retail sales have been hot for the past year, but have pulled back recently as inflation continues to rise. Consumer confidence is concerning as it failed to break above 100 and has been falling steadily since April. If Covid shifts to a more endemic phase like the flu managed with vaccines and therapies as many experts have been indicating and the economy and life continues to return to normal – and inflation cools down by mid-2022 as we expect – then confidence will return to the consumer.
On the good news front the Unemployment Rate continues to decline and remains at a healthy low level of 4.2% seasonally adjusted (3.9% not seasonally adjusted). The “Help Wanted” signs are everywhere and most anyone who wants a job can find one. Wages also continue to rise so when the holdouts from the pandemic come back to work they should be well paid. Initial jobless claims up-ticked recently off the post-pandemic low, but this does not concern us as the level remains low and the trend is lower.
Finally, our inflation horseman as measured by our 6-month exponential moving average calculations on the CPI and PPI have risen sharply since summer 2020, which should not come as a major shock considering the massive government spending and quantitative easing we’ve had over the past 18 months or so. CPI is at the highest levels since 1991 and PPI, fueled higher by supply chain disruptions, is at levels not seen since the peak of the stagflation days in early 1975. As Covid turns endemic and manageable and supply chains bottlenecks are loosened, the Fed should be able to quell inflation sometime in the middle of next year.
JAN
2022