

It’s been a dynamic six weeks since we made our Annual Forecast for 2021 and volatility spiked the last week of January as the merry Gen Z traders made on run on the shorts of the old guard on Wall Street. Robinhood Markets and other trading apps and services and online communities used by younger up-and-coming retail traders were able to organize en masse and create an old-fashioned short squeeze. You’ve got to hand it to them.
Just like all new investment and trading vehicles and trends this will get under control. But as we have seen in recent years this sort of thing is becoming more frequent as connectivity and technology bring the world closer together with transactions and communications transpiring near the speed of light. This is a market flaw that runs the risk of injuring innocent investors who are not privy to what is happening.
Honestly, we’ve seen this before over the years. There is always a new twist and this one will get hammered out by the exchanges, the broker/dealers, the new platforms and the regulators. While it may be exciting to see the next generation embracing the market and flexing their muscle our markets thrive on fair and orderly transactions. Admittedly a little comeuppance every now and then is interesting and it does help to keep the big players more transparent on their toes.
Members of Congress from both sides of the aisle chimed in on the subject as lawmakers criticized trading restrictions of the hot-button stocks on these platforms. The new Biden administration has stated that its economic team is monitoring the situation. Perhaps this will be the issue that helps bring our divided government closer together.
Technically speaking, by some measures, the market is over extended and the selloff on Wednesday, January 27, 2021, the biggest one-loss since October, was to be expected. Valuations and sentiment are also high. The retreat was also triggered by some disappointing earnings and perhaps the voracity of the Biden administrations barrage of executive orders and the realization by the markets that there’s a new sheriff in the White House.
But we don’t foresee a selloff of any major consequence. Pullbacks and consolidations are bound to happen and February is the weak link in the Best Six Months and worse in post-election years. Let’s look at the technical picture first. Since the market has been dominated by tech and big tech even more for the past year during these Covid times the NASDAQ 100 Index (NDX) is the index of focus.
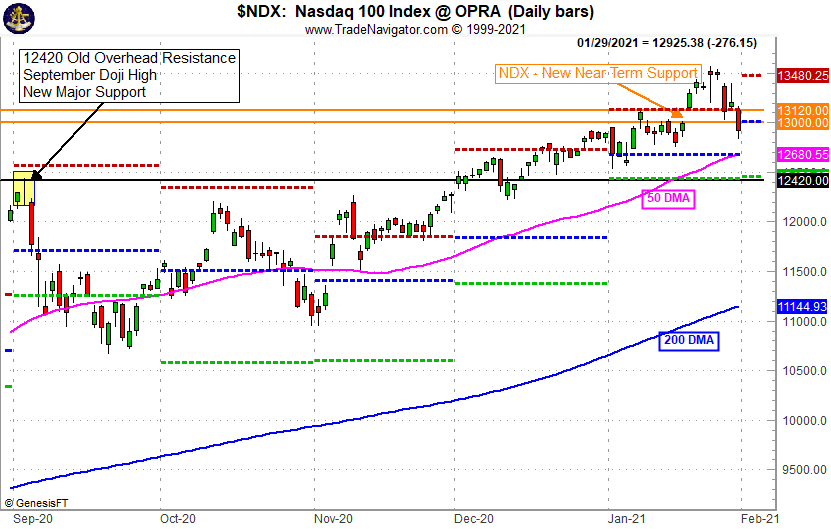
The selloff tested new support levels that have formed just above the yearend highs and the early January consolidation as well as in that gap between the January 19 close and the open on the pop on January 20. The old major overhead resistance at the September 2 high was cleared by the usual strength in the last half of December and the Santa Claus Rally. That appears to be the new major support level at NDX 12420.
Our forecast for the yearend rally to continue was on track as the market closed 2020 at new all-time highs. Market behavior remains on track with historical seasonal patterns. This was confirmed by the arrival of the Santa Claus Rally (SCR), which registered a 1% gain for the 7-trading-day stretch that ended on January 5. Gains continued into the first week of January pushing the First Five Day (FFD) early warning system solidly into the black. That put our January Indicator Trifecta at two for three momentarily.
But the market decline at the end of January cancelled the bullish January Indicator Trifecta. Regardless of where the blame falls for the sell off, the market had gone quite a distance in a relatively brief period of time and valuations and technical readings in many areas of the market were stretched. S&P 500 finished January down 1.1% and thus the January Barometer is negative.
Devised by Yale Hirsch in 1972, the January Barometer has registered eleven major errors since 1950 for an 84.5% accuracy ratio. This indicator adheres to propensity that as the S&P 500 goes in January, so goes the year. Including the eight flat years yields a .732 batting average.
The near-term outlook for the market has diminished as every down January (page 20 Stock Trader’s Almanac 2021) since 1950 was followed by a new or continuing bear market, a 10% correction or a flat year. However, it is challenging to envision a full-blown bear market with the Fed keeping a close eye on the market and the new administration working on additional fiscal stimulus.
This year’s combination of a positive Santa Claus Rally and First Five Days with a full-month January loss has only occurred twelve times (including this year) since 1950. In the previous eleven occurrences S&P 500 was down seven times in February with an average loss of 2.2%. However, over the remaining 11 months of the year, S&P 500 advanced 81.8% of the time with an average gain of 8.2%. Full-year performance was positive 72.7% of the time, but with an average gain of 4.1%.
Because we do not rely solely on a single indicator or pattern, DJIA’s December closing low of 29823.92 is still a key level to be watched. The reversal on the last day of January could have been entirely due to the less than expected results from J&J’s vaccine. The market’s response in early February will be key as to whether or not recent market weakness manifests into a deeper pullback or correction.
![[Mixed January Indicator Table]](https://www.probabilitiesfund.com/wp-content/uploads/2021/02/SS_0221_20210203_Trifecta_Mixed.jpg)
Needless to say we have concerns. Aside from this new Robinhood short squeeze, sentiment remains extremely frothy and complacent with the weekly CBOE Equity Only Put/Call Ratio hovering at historic lows around and under 0.40 since Thanksgiving. Then there are the rich valuations and extended technicals. Plus we have a pandemic that’s still raging, roadblocks in the vaccine rollout, a struggling travel/leisure/hospitality sector and still elevated unemployment.
On top of all that it’s a historically weak post-election year and we are heading into February, the seasonal weak spot of the Best Six Months. But as we discussed in the Annual Forecast last month the markets have done better in recent post-election years and even better under new democrats with democratic control of congress. And while February is even weaker on average in post-election years most of the damage that brings the averages down came from massive losses in February 2001 and 2009.
However, there is strong support for the bull. The Fed continues to have our back with a commitment to keep rates at near zero for the foreseeable future and continue to flood the market with cash. More fiscal stimulus is likely on the horizon and most importantly if we can gain any traction with the vaccine rollout, pent-up demand is likely to rev the economy up again and push the market to new heights.
For now be prepared for a February pullback, but nothing sinister. With seasonality back in gear and the prospects for reining in the Covid-19 pandemic improving we expect the market to be positive for the year somewhere in range of our best and base case Annual Forecast scenarios.
FEB
2021