

The Dow posted a 7.2% gain for the month of January – not only its best monthly gain in the past three months, but its best January since 1989. S&P 500 outpaced the Dow with a 7.9% gain for the month – its best January since 1987, scoring our third January Indicator Trifecta in a row. Further details on the bullish implications of the January Indicator Trifecta can be seen here “January Barometer 2019 Official Results.”
NASDAQ stocks racked up even better gains than Dow and S&P posting a 9.7% gain for January, its best January since 2001. However, the Russell 2000 Index of small cap stocks was the star of the month beating all the major U.S. indices with a whopping January gain of 11.2%, its best January since 1987. This is also reassuring as small caps have a long history of outperforming large caps in the month of January, known as the “January Effect.” Small Caps outperforming in January suggest a healthy market exhibiting normal bullish behavior.
This phenomenon was first identified by the economist and investment banker Sidney Wachtel in his 1942 paper “Certain Observations on Seasonal Trends in Stock Prices” in the Journal of Business published by the University of Chicago press. Mr. Wachtel studied and tracked the seasonal movements of the stock market and is believed to have coined the term “January Effect.”
Market internals suggest the market likely found at least an interim low on December 24, 2018 with the highest Weekly CBOE Equity Only Put/Call Ratio since January 2016 registering 0.92 on December 21, the Friday before the “Christmas Eve Crumble.” This contrary sentiment indicator often spikes near the 1.00 level or higher at major lows as investors and traders buy protective puts en masse.
The NYSE Advance-Decline Line, New Highs and Lows provide additional support for the “Christmas Eve Crumble” low. Weekly Advancers, Decliners, New Highs and New Lows all hit rather extreme levels throughout December especially the week ending December 21. Market breath measured by NYSE Weekly Advancers and NYSE Weekly Decliners has been bullish since late December with Advancers outnumbering Decliners by wide margins in four of the last five weeks.
Weekly New Lows spiked to their highest number since November 2008 in mid-December at 1648. Weekly New Highs nearly fell into the single-digits then. Since then, Weekly New Lows have retreated significantly while Weekly New Highs expanded slightly. Major indexes are currently around the mid-point between their respective December lows and recent all-time highs so New Highs and New Lows are likely to remain somewhat subdued.
But keep the 2008-2009 bear market bottom in the back of your mind and remain on alert for a retest. Internals were weakest and at extreme levels in November 2008, yet the market made its ultimate low in March 2009 on stronger internals.
At this point the market appears to be tracking our Base and Best Case scenarios from our 2019 Annual Forecast last issue. Fed Chairman Jerome Powell is sounding much more dovish now and the FOMC left interest rates unchanged at January 30 meeting. In addition to leaving interest rates unchanged, the market was pleased to hear the Fed express flexibility on its balance reduction strategy, patience with increasing rates further and data dependence. In his official remarks after the FOMC meeting Powell himself said, “The case for raising rates has weakened somewhat.” Long time readers will remember we have been suggesting this for months.
The prospects for 2019 have improved dramatically over the past five weeks. The Fed has removed its blinders and backed off its unwavering stance to raise rates and reduce its balance on a rapid pace. President Trump has begun to tack to the center a hair with the Dems and the Chinese. If that continues and his adversaries reciprocate prospects for our Best Case scenario for 2019 improve.
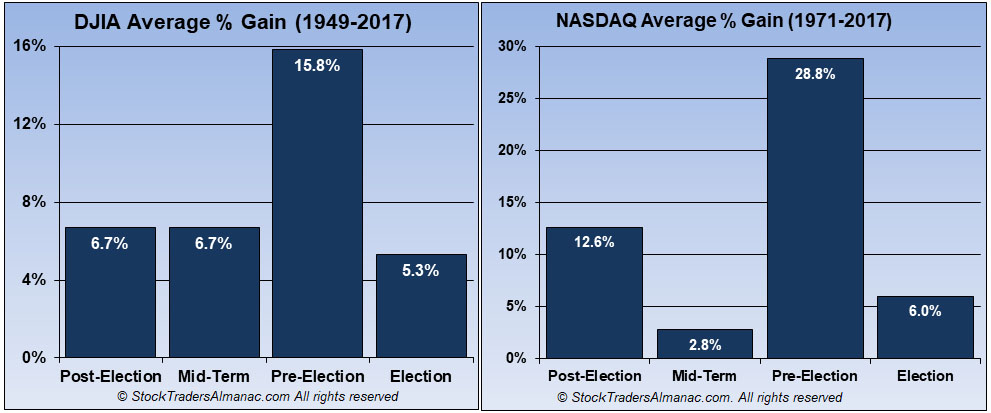
Lastly, as we mentioned last issue, after the late Midterm Year correction, more normal Pre-Election Year gains are now likely in 2019. The Pre-Election Year or 3rd Year of the 4-Year Election Cycle is the best of the 4 by a wide margin. DJIA averages 15.8% since 1949 and NASDAQ Composite averages 28.8% since 1971.
FEB
2019