

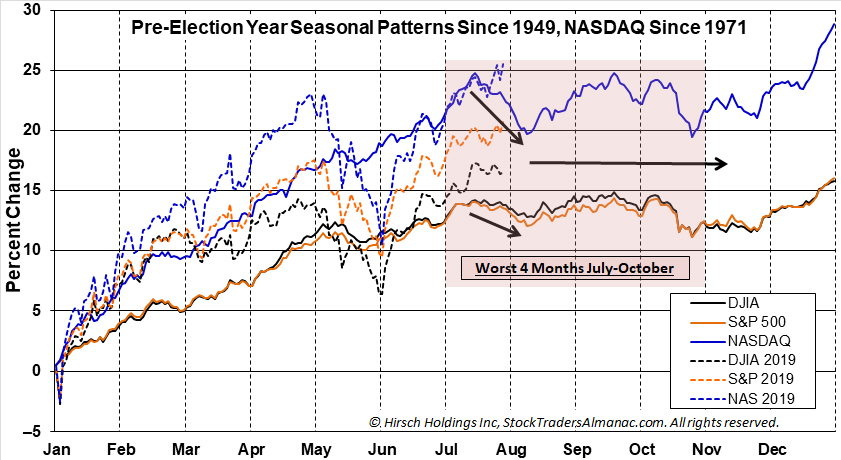
Major U.S. stock market indices continue to track historic seasonal patterns and the historical seasonal pattern for Pre-Election Years quite closely this year and that suggests it is likely to continue to do so. The Dow, S&P 500 and NASDAQ have just logged new all-time highs and while that is bullish for the year as a hole and the second half in general it does indicate that we are ripe for a seasonal pullback.
As you can see in the accompanying chart mid-July in Pre-Election Years is frequently a point where the market begins its seasonal retreat after hitting new highs. Then after choppy, sideways, backing and filling action over the “Worst Four Months” July-October, additional new highs are usually reached in December and often at yearend, even on the last trading day of the year.
Frankly, the market is really getting everything it wants. At least a quarter point Fed rate cut is likely at the end of July. President Trump and the Democrats have just worked out a new budget and debt ceiling deal that should be signed into law shortly. The trade battles and negotiations continue crawling along and every time things look a little shaky the Trump administration sends top officials for high level talks with China. Up until recently, economic readings and corporate results have been solid. This has all been a boon for stocks.
But now as economic data and earnings season has not been exceedingly firm, seasonal weakness, technical resistance and elevated sentiment have created an environment where the market is likely to retreat toward recent support levels around the March and June 2019 lows near Dow 25000, S&P 2725 and NASDAQ 7333 over the next three months – in the 8-12% correction area.
However, our longer term outlook for yearend and Election Year 2020 remains bullish. So here’s a little preview of our outlook for 2020 from the Stock Trader’s Almanac 2020 that we just sent to the press for you, our loyal Seasonal Strategist Newsletter readers.
For 2020, we could easily join the throng of skeptics and bears that are forecasting recession and a down market for 2020 and stoke investor’s fears, but we have three main observations that have guided us toward a more bullish outlook for Election Year 2020.
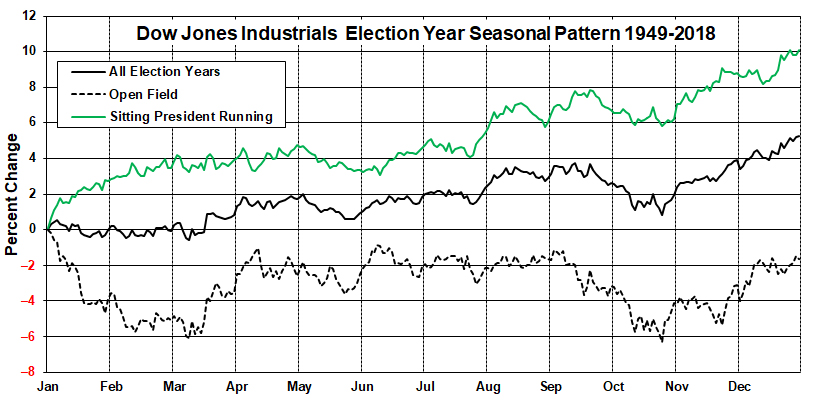
1. The Power of Incumbency. As you can see in the accompanying chart the stock market has performed much better in election years when a sitting president is running for reelection. Since 1949 the Dow is up 10.1% in election years when a sitting president is running for reelection vs. 5.3% in all election years and –1.6% in election years with an open field and no incumbent commander-in-chief running for a second term.
2. Fiscal and Monetary Policy Synchronicity. After several years of conflicting policy the Federal Reserve and the U.S. Federal government are finally getting in synch. Interest rates are historically low and the Fed is on the brink of lowering rates at the same time as fiscal policy has been lowering taxes and increasing spending. These dual pro-growth policies should continue to propel the stock market higher.
3. Recent Pattern of 50% Moves Following Extended Consolidations. An interesting pattern has materialized following the past few market consolidation phases. After bouncing around a base for 2-3 years the DJIA has rallied 50% higher. Following the 2009 secular bear market low the market rose to the 12,000 level on the Dow in February 2011 and then moved sideways for about 2 years up and down and around 12,000. Then it took off at the end of Election Year 2012 rising 50% to 18,000 at the end of 2014. DJIA stayed close to 18,000 until just after the election in 2016. Then it jumped up another 50% near 27,000 in January 2018. Until July 2019 DJIA had been unable to breakthrough 27,000. If this pattern continues, the next 50% move higher may gain momentum in 2020.
These gains will of course not come without pause and correction. The world stage will continue to feature some challenging geopolitical, diplomatic, trade-related and economic storylines. U.S. presidential campaign politics will increasingly focus on domestic political disputes, standoffs and unfinished business. But when all is said and done we expect 2020 to be an up year based on the historical patterns and cycles and current favorable policies, relatively healthy economics, a dovish Fed and positive market behavior. This all points to the likelihood that our May 2010 Super Boom Forecast when the Dow was around 10,000 for the Dow to reach 38,820 by the year 2025 may be ahead of schedule.
JUL
2019