

Since Christmas the market has ripped higher on supportive market internals, still solid overall fundamentals and improving technicals. In line with the Seasonal Market Probability Calendar (graphically represented on page 20 of the Stock Trader’s Almanac 2019 in the “February Almanac”) the market succumbed to usual February weakness after the first few days of the month and again around the Presidents’ Day holiday and again today on the usually bearish last trading day of the month.
As you can see in the chart here of the S&P 500 this pause is also coinciding with technical resistance at 2815. We drew this resistance line on the chart over six weeks ago in our “Resistance is Not Futile” post. This resistance sits on the November 7, 2018 intraday high when the rally faltered back in the fall. As noted by our colleague Patti Domm at CNBC, S&P 2800 is the level market technicians are watching closely.
The two yellow boxes in the chart highlight the seasonal weak spots mentioned above from the 4th-7th trading days of February, around Presidents’ Day and on the last trading day of the month. After diving through the August 2017 low support level and then springing back up through it on Christmas, the market paused at the February 2018 low resistance level and again at the October-November 2018 lows that were blown out in December. Now that we have cleared the 200- and 50-Day Moving Averages we have the aforementioned November high at 2815 to clear before we can attack new all-time highs.
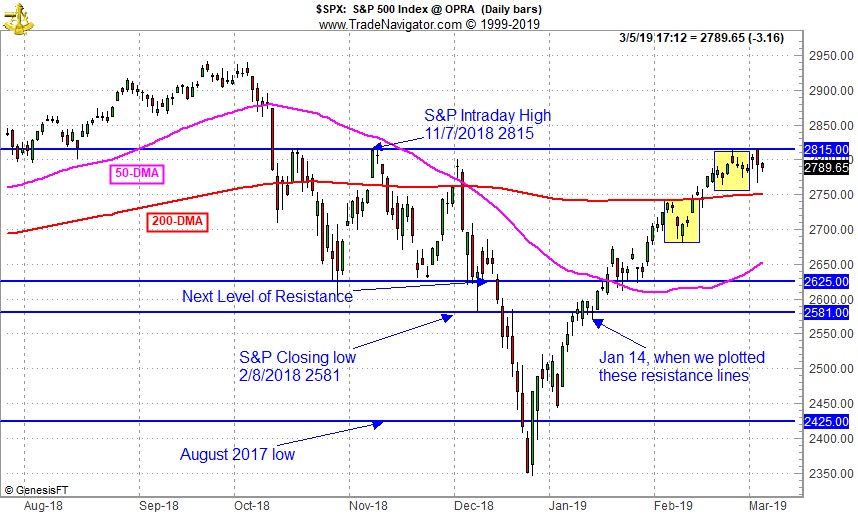
We don’t expect to take out the old high so fast. More likely we will dance around this 2815-level for a few months. Mid-March strength may push us above this level, but then end-of-March weakness is likely to retest this level again. Provided we avoid any unexpected geopolitical snafus the all-time highs could be tested in Q2 and perhaps exceeded, followed by backing and filling in Q3. Then we expect the market to make another run at new highs in the 4th quarter where many Pre-Election Year highs have been logged over the years.
Overall our outlook remains positive. Seasonal indicators are strong with our January Indicator Trifecta positive 3-for-3 and the Best Six Months back in the black up about 3% across the board after a wild ride at the end of 2018. The market has impressively digested the dynamic news flow so far this year with an improved market internal environment as the NYSE Advance-Decline made new highs recently illustrating the broad participation in the rally.
There may be bumps and volatility this year, most likely around the end of March and during the Worst Four Months July-October. But in the end we expect solid gains for 2019.
MAR
2019