Posts Tagged '4-year cycle'

Almanac Update February 2019: Generally a Tepid Month for Large Caps

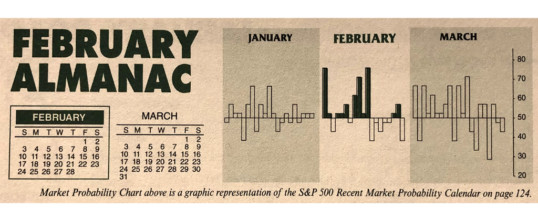
Even though February is right in the middle of the Best Six Months, its long-term track record, since 1950, is not all that stellar. February ranks no better than seventh and has posted paltry average gains except for the Russell 2000. Small cap stocks, benefiting from “January Effect” carry over; tend to outpace large cap stocks in February. The Russell 2000 index of small cap stocks turns in an average gain of 1.1% in February since 1979—just the seventh best ...

Continue Reading →
0

January Barometer: Trifecta Up 3-For-3 Bullish for 2019

S&P 500 finished the month strong with a 7.9% gain. This is the best S&P January since 1987. This is also the third January Trifecta in a row. Last year the S&P 500 crumbled in the fourth quarter under the weight of triple threats from a hawkish and confusing Fed, a newly divided Congress and the U.S. trade battle with China, finishing in the red. 2017’s Trifecta was followed by a full-year gain of 19.4%, including a February-December gain of ...

Continue Reading →
0

Almanac Update January 2019: Top Month for Stocks in Pre-Election Years

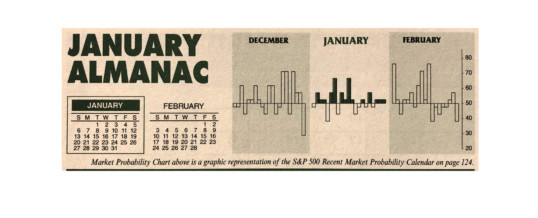
January has quite a legendary reputation on Wall Street as an influx of cash from yearend bonuses and annual allocations typically propels stocks higher. January ranks #1 for NASDAQ (since 1971), but sixth on the S&P 500 and DJIA since 1950. It is the end of the best three-month span and holds a full docket of indicators and seasonalities.

DJIA and S&P rankings did slip from 2000 to 2018 as both indices suffered losses in ten of those nineteen Januarys with ...

Continue Reading →
0

Market Outlook November 2018: Midterm Time Is Bullish

For the past several months we have often heard investors and commentators saying, “Sell in May did not work this year and it hasn’t worked for the past several years” or “Sell in May is dead.” Not true. Everyone forgot about October. We always are leery of October.

The recent spell of 2-3% daily market moves has many concerned that this could turn into something more sinister or bearish. That is always a concern and still possible, but it does not ...

Continue Reading →
0

So “Sell in May” Didn’t Work This Year?

Not so fast. The answer is: We don’t know yet, the Worst Six Months (WSM) are not over yet. People forget that Sell in May is NOT the whole seasonality. Our Best and Worst Months Tactical Switching Strategies are based on the Dow’s and S&P’s Best Six Months (BSM) from November through April and the Worst Six Months from May through October, and NASDAQ’s Best Eight Months (B8M) from November through June and the Worst Four Months (W4M) from July ...

Continue Reading →
0

Octoberphobia Strikes Again

Okay. Everybody relax. This is normal. This is a standard October seasonal selloff. There is a long and recent history of this sort of October market volatility. Today the market suffered its worst DJIA and S&P day since February 8, 2018 and the worst NASDAQ day by percent since June 24, 2016, the day after the Brexit vote.

This is typical October behavior. And like we said last week this is to be expected at the beginning of ...

Continue Reading →
0

Market Outlook October 2018: Midterm October Launching Pad

Historically, the “Worst Six Months” (WSM) of the midterm year has been weaker than WSM in all other years of the 4-Year Presidential Election Cycle, with Q2-Q3 of the midterm year being the weakest consecutive two-quarter combo of the cycle. August and September have historically been the worst two months of the year, though they rank higher in midterm years, but have still posted average losses in midterm years since 1950.

This has not been the case this year. Despite a ...

Continue Reading →
0
Page 2 of 3 123