

Okay. Everybody relax. This is normal. This is a standard October seasonal selloff. There is a long and recent history of this sort of October market volatility. Today the market suffered its worst DJIA and S&P day since February 8, 2018 and the worst NASDAQ day by percent since June 24, 2016, the day after the Brexit vote.
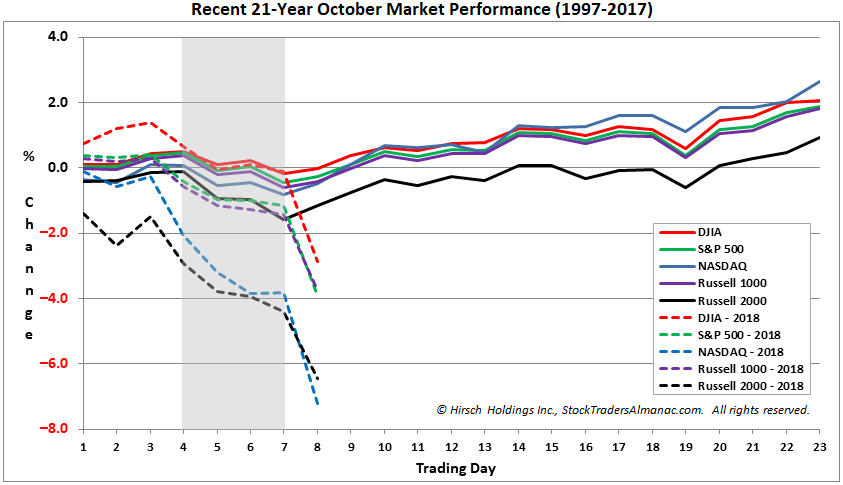
This is typical October behavior. And like we said last week this is to be expected at the beginning of October. The typical October chart is updated below with the current month-to-date performance as of today’s close overlaid. We may get some more downside this year than the average October, but with all the midterm machinations, Fed activity, frothy sentiment and rich valuations that is understandable.
In all likelihood, the correction has a bit more to go, perhaps as deep as the correction in Q1 this year. Remember all the talk about how long we went without a 10% correction? Well, welcome to a little mean reversion. But as we conveyed back in February, remain calm and stick to the strategy. Aside from the political maneuverings and the trade war rhetoric three main reasons drove the market down this month: The Fed, seasonality and a technical breakdown today.
The Fed, perhaps rightfully so, has continued to raise short term rates towards what it deems a “neutral” or normal level in good economic times, while at the same forecasting a slowdown in long-term economic growth rates. Then when 30-year Treasuries closed above 3.25% for the first time in 4 years, the market began to get spooked that the low rate punchbowl was really finally being taken away. We have held that the Fed is the biggest risk to the market.
Then there was a technical breakdown today through support that was piled onto by program and algorithmic trading. Certain levels were breached and the selling floodgates opened. I’m not going to get into the technical charts today, I’ll save that for another post soon, but NASDAQ broke through its 200-day moving average and if it doesn’t find support here the next level of support is 7250, which is about a 10% correction. Dow and S&P are still above their 200-day MAs, but not by much. If they don’t hold their 200 DMAs the next level of support is about 24750 for the Dow and 2725 for S&P, both in that 7-8% correction range. I’ll discuss further support in the next blog…
October volatile seasonality is well known and well-documented in the Stock Trader’s Almanac. Yes, Octobers are normally much better in midterm years, but less so after big gains in the first 9 months of the year as we had this year. In the 17 midterm years since 1949 when the S&P 500 was up for the first 9 months (9 times) October gained an average of 1.6%, when it was down the first 9 months (8 times) S&P averaged gains of 5.2%.
October is the best time to buy stocks (see page 90 in the 2018 Stock Trader’s Almanac) and late October is the best time to buy depressed stocks, especially techs and small caps (page 94). Our defensive and cautious stance is paying off so be patient and wait for our all-clear technical buy signal.
OCT
2018