

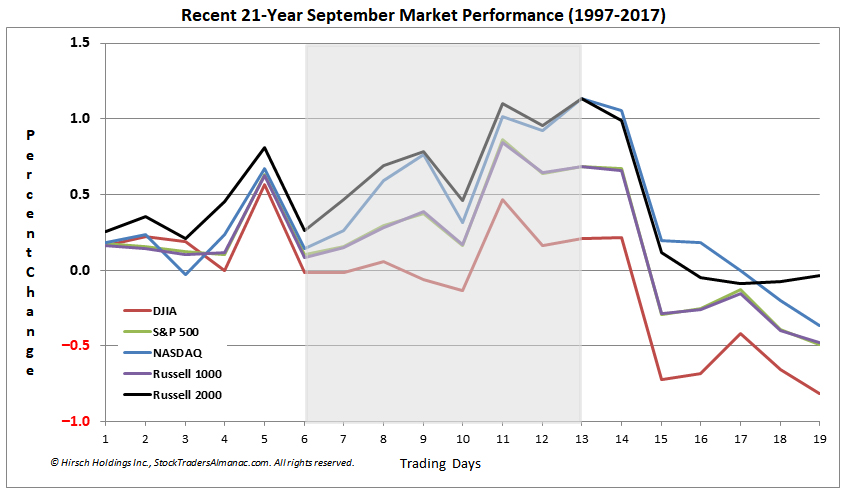
Although August is the worst month of the year for the market since 1987 (recent 31-year period), September is the worst month going back to 1950 for DJIA and S&P 500. It is also the worst month for NASDAQ since 1971 and the worst for Russell 1000 and 2000 since 1979. Looking at the full month of September one day at a time, just before mid-month has offered the bulls the best opportunity with the chart exhibiting strength from around the close of the sixth trading day to the close of the thirteenth trading day. The tenth and twelfth trading days briefly interrupt the trend. After this stretch, the final third of the month is generally weak with all five indexes quickly surrendering earlier month gains.
5
SEP
2018
SEP
2018
0