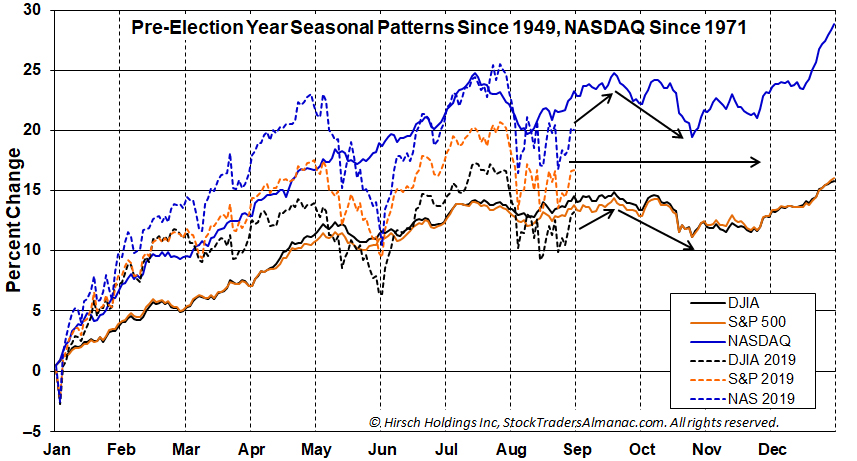
Last month we warned that the market was ripe for a seasonal pullback. Within days of our monthly missive late-July and early-August delivered their typical seasonal weakness, of course with a little help from the Fed, yield curve and hot-button geopolitics. At the risk of sounding like a broken record, we expect the market to continue to track the seasonal and 4-year election cycle patterns closely as it has all year long.
Our updated chart of Pre-Election Year Seasonal Patterns overlaid with 2019 to date highlights the amplitude of August 2019 price swings as well as how closely market price action this year has tracked the historical trend and pattern. This suggests 2019 will continue to move in synch with the seasonal moves depicted on the chart.

So we expect the market to move higher toward the July highs until the last week of the September, which is the treacherous Week After Q3 Triple Witching – down 23 of the last 29 years for the S&P 500. Then the market tends to have a downward bias until late October.
The CME Group’s FedWatch Tool currently has the odds of a ¼ point rate cut at the next meeting on September 18 as a virtual lock at 90.4%. Many on The Street are secretly (or not so secretly) expecting a ½ point cut. Negative market reaction to only a ¼ point and perhaps some more ambiguous comments from Fed Chair Powell, could fall right in line with Q3 Triple Witching volatility, end-of-September seasonal weakness after quarterly expiration and institutional portfolio restructuring and window dressing.
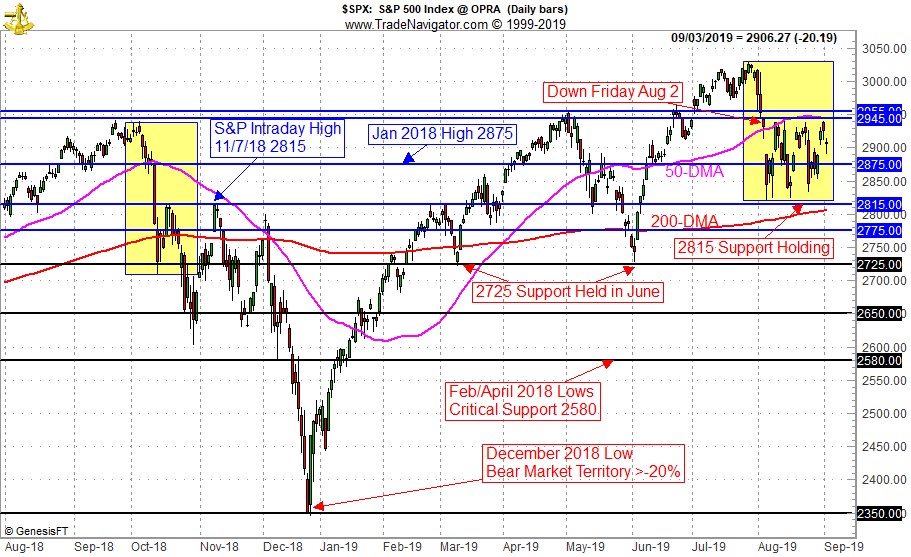
Technically speaking, the market has settled into a range between 2815 and 2945 on the S&P 500. S&P 2815 is a support level we have been tracking for some time now that sits at the intraday high back on November 7, 2018 where the market failed last fall before the 20% correction ran its course to the Christmas Eve low. The good news is the 2815 has held here this time unlike the ~2700 level last fall.

The bad news or at least the technical case for no new highs is that the S&P has yet to clear the 2945 level, which was the intraday high on Friday August 2 that was the beginning of two back-to-back Down Friday/Down Mondays, which has a negative indication if not quickly reclaimed.
So look for the market to drift higher into mid-September with a struggle to break above 2945-2955 on the S&P, which is right at the 50-day moving average (DMA). If it can clear that level it may be able make a run at the highs before turning lower the last week of September. October could likely see a retest of 2815 with the 2725 support level that was held in June also being in play. Stick to the drill and wait for our Best Six Months Seasonal Buy Signal before jumping back in with both feet.
SEP
2019
