Posts Tagged 'Sell in May'

Almanac Update May 2022: A Challenging Month in Midterm Election Years

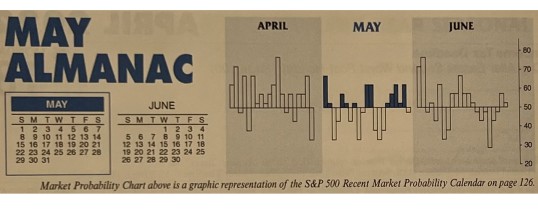
May officially marks the beginning of the “Worst Six Months” for the DJIA and S&P. To wit: “Sell in May and go away.” Our “Best Six Months Switching Strategy,” created in 1986, proves that there is merit to this old trader’s tale. A hypothetical $10,000 investment in the DJIA compounded to a gain of $1,230,865 for November-April in 71 years compared to just $2,693 for May-October (STA 2022, page 54). The same hypothetical $10,000 investment in the S&P 500 compounded ...

Continue Reading →
0

June 2021 Outlook: NASDAQ Best 8 Months Ends – Sideways Summer Trading

Stocks have gone virtually nowhere since Stock Trader’s Almanac April 22 Best Six Months MACD Seasonal Sell Signal. Trading volume has already begun to slowdown as it tends to do from Memorial Day to Labor Day in what we refer to as the summer doldrums. This reduction in trading volume (page 48, STA 2021) both contributes to and is emblematic of seasonal market weakness during the Worst Six Months May-October (page 147, STA 2021) and the Worst Four Months July-October ...

Continue Reading →
0

May 2021 Outlook: Muted Market Action Anticipated Over Worst Six Months

Seasonality remains back to normal and it appears from all our observations that it will continue to track historical patterns for the remainder of the year. April’s solid returns across the board led by S&P 500 (up 5.2%) and NASDAQ (up 5.4%) and new highs for DJIA, S&P 500 and NASDAQ capped off a banner Best Six Months. DJIA is up 27.8%, S&P 500 is up 27.9%, NASDAQ is up 28.0% and the Russell 2000 is up an amazing 47.3% ...

Continue Reading →
0

April 2021 Outlook: Late-March Weakness Sets Up End of Best Six Months Rally

The last month of our “Best Six Months” is now upon us. So it’s the perfect time to provide a refresher for longtime readers and primer for those that have recently joined us. We do not simply “Sell in May and go away.” We employ a more nuanced and subtle approach to how we implement our Best & Worst Months Switching Strategies detailed in the annual Stock Trader’s Almanac and on www.stocktradersalmanac.com. We are Continue Reading →

0

Almanac Update May 2020: Weaker in Election Years

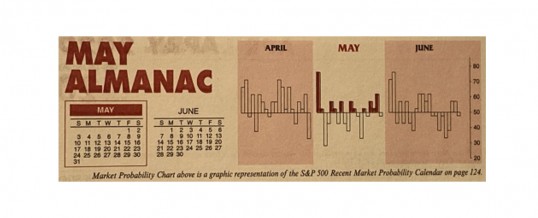
May officially marks the beginning of the “Worst Six Months” for the DJIA and S&P. To wit: “Sell in May and go away.” Our “Best Six Months Switching Strategy,” created in 1986, proves that there is merit to this old trader’s tale. A hypothetical $10,000 investment in the DJIA compounded to a gain of $1,068,826 for November-April in 69 years compared to just $1,461 for May-October. The same hypothetical $10,000 investment in the S&P 500 compounded to $823,326 for November-April ...

Continue Reading →
0

Market Outlook June 2019: May’s Selloffs Yield June Boons

On the heels of one of the strongest January to April starts, May was destined for weakness. But this bodes well for June. May is notoriously weaker in pre-election years, like 2019, and after big starts to the year. The first four months of 2019 were up 17.5% for the S&P 500, the third best since 1950. Following the previous top 20 starts May was down 9 times for an average gain of 0.2%. June is more bullish in general ...

Continue Reading →
0

Strong Starts & Weak Mays: A June Boon

Previous analysis of big gains the first four months indicated weakness was in store for the merry month of May. Now that the market has indeed suffered this May the outlook for June is a boon at least historically speaking.

The table below shows the top 20 first four month gains for the for the S&P 500 with the subsequent changes for May, June, Rest of the Year, “Worst Six Months” May-October, 2nd half July-December and full year performance. While most ...

Continue Reading →
0

Almanac Update May 2019: Challenging Month in Pre-Election Years

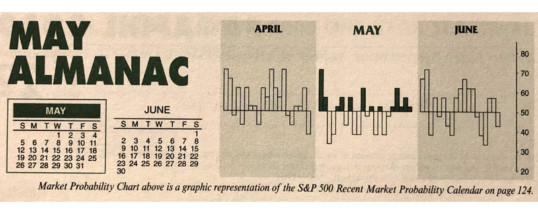
May officially marks the beginning of the “Worst Six Months” for the DJIA and S&P. To wit: “Sell in May and go away.” Our “Best Six Months Switching Strategy,” created in 1986, proves that there is merit to this old trader’s tale. A hypothetical $10,000 investment in the DJIA compounded to a gain of $1,008,519 for November-April in 68 years compared to just $1,031 for May-October. The same hypothetical $10,000 investment in the S&P 500 compounded to $720,389 for November-April ...

Continue Reading →
0