

The last month of our “Best Six Months” is now upon us. So it’s the perfect time to provide a refresher for longtime readers and primer for those that have recently joined us. We do not simply “Sell in May and go away.” We employ a more nuanced and subtle approach to how we implement our Best & Worst Months Switching Strategies detailed in the annual Stock Trader’s Almanac and on www.stocktradersalmanac.com. We are not issuing the signal at this time.
As we prepare for the upcoming Best Six Months Seasonal MACD Sell Signal that can occur any time on or after April 1 there are several factors and aspects of the strategy we’d like to be sure you’re up to speed on. DJIA’s and S&P 500’s “Worst Six Months” are May through October. NASDAQ’s “Worst Four Months” are June through October. We begin tracking DJIA and S&P 500 for our “Best Six Months” MACD Seasonal Sell Signal on or after April 1. We begin tracking NASDAQ for its “Best Eight Months” MACD Sell Signal on or after June 1.
All three indices are currently in sell mode (as of 3/25/21 close). We will issue our Seasonal MACD Sell Signal when corresponding MACD Sell indicators applied to DJIA and S&P 500 both crossover and issue a new sell signal on or after April 1. We will not be issuing our NASDAQ Best Eight Months MACD Sell Signal until on or after June 1. Historical dates for the “Sell Signal” can be seen in the tables under the “Our Strategy” tab on the Stock Trader’s Almanac website.
April Rally
Recent weakness following the Ides of March arrived on cue with historical seasonal trends as you can see in the chart below of the “S&P 500 One-Year Seasonal Pattern Since 1949.” Weakness during the week after Triple Witching is rather typical as we discussed last month and as is detailed in the Stock Trader’s Almanac 2021. Thursday, March 25th’s late-day rebound is encouraging, but the last several days of March often succumb to end-of-Q1 selling pressures. Late-March weakness has frequently been recovered early in April.
Once those end-of-Q1 pressures are alleviated we expect April to deliver its usual upside performance. In fact, this recent weakness sets up well for an April rally. An April rally would in turn set up a solid Best Six Months MACD Seasonal Sell Signal. With only 7 S&P 500 losses in the last 31 years, April has been a consistent performer. April is the first month of the second quarter and welcomes in the new earnings season, which promises to help buoy stock prices as year-over-year comparison should be improved over last year’s Covid-impacted numbers.
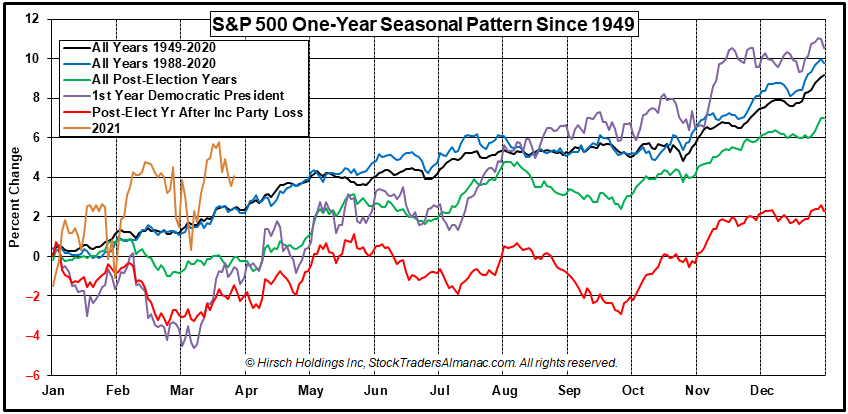
Seasonal patterns remain on track as you can see in the chart; though they are more pronounced from the powerful post-Covid bear market recovery rally and recent increased volatility. Levels may be more extreme, but the seasonal trends remain intact this year as they have been since September 2020 as we last illustrated in the December Outlook. 2021 as represented by the orange line in the chart above has exhibited rather typical post-election year seasonal patterns with the late-February weakness, early March strength and the recent week after Triple Witching selling.
In addition to April bullish seasonality current fundamentals are supportive. Vaccines are rolling out as hoped and positive cases continue to retreat here in the States. The jobs market continues to improve and funds are flowing from the latest giant stimulus legislation. Q1 GDP and earnings are expected to be robust, but valuations are high and the threat of higher taxes could take the air out of the market.
The Fed has managed to appease the market for the time being, but if inflation fears ramp up quickly, pushing long bond yields higher, the market is prone to a correction or consolidation. Lingering pandemic/vaccine and geopolitical issues around the world, along with teetering market internals, a stretched technical picture, and the end of the Best Six Months November-April on the horizon, it is not inconceivable to expect the market to consolidate over the Worst Six Months May-October (AKA “Sell in May”).
The market is also prone to some mean reversion after the 1-year gain of 74.8% on the S&P 500 from the March 23, 2020 low. We ran the numbers on the 1-year rolling returns for the S&P 500 back to 1949 on the blog on March 24th. While these giant spikes do come at the early stages of extended bull runs, gains of this magnitude have not been sustained and the market has tended to revert to the mean. The arithmetic mean or average rolling 1-year return since 1949 is 9.2%, which isn’t bad either.
Last time we had a 1-year rolling return of this magnitude in 2010 when the S&P was up 68.6% on March 9, 2010 from the March 9, 2009 secular bear market low we had a 10.3% correction to the July 2, 2010 low and a 15.7% rolling 1-year return from March 9, 2010 to March 9, 2011. And let’s not forget the May 6, 2010 flash crash. While we are by no means “bearish” perhaps a little caution and portfolio defense in the near future is not a crazy idea.
The prospects for the resumption of the rally are encouraging, but heeding our “Sell Signal” when it arrives may reduce risk in the event April fails to live up to its reputation. Avoiding losses is even more important than making gains.
MAR
2021