

Seasonality remains back to normal and it appears from all our observations that it will continue to track historical patterns for the remainder of the year. April’s solid returns across the board led by S&P 500 (up 5.2%) and NASDAQ (up 5.4%) and new highs for DJIA, S&P 500 and NASDAQ capped off a banner Best Six Months. DJIA is up 27.8%, S&P 500 is up 27.9%, NASDAQ is up 28.0% and the Russell 2000 is up an amazing 47.3% since the close of October through the close on April 30.
Our Best Six Months MACD Seasonal Sell Signal triggered on the close of April 22. From Stock Trader’s Almanac November 5 Buy Signal DJIA gained 19.1% and S&P advanced 17.8%. The Sell Signal looks rather timely with the MACD crossover or negative histogram occurring well above the zero line. NASDAQ’s Best Eight Months ends June 1 so the running gains so far are 17.4% for NASDAQ and 36.5% for Russell 2000 as of the April 30 close. June 1 is the earliest NASDAQ’s Seasonal Sell can trigger.
We are not proponents of the indiscriminate “Sell in May and go away” philosophy. Instead of selling in May, we prefer to “Reposition in May.” Our strategy shifts to a more neutral stance after the Seasonal Sell Signal.
In case you missed it, I discussed my Worst Six Months outlook and strategy in my April 28 webinar: “Sell in May But Don’t Go Away! Tactical Seasonal Sector Rotation & Stock Trading Strategies.” You can watch the replay if you register at this link https://attendee.gotowebinar.com/register/5753287365631356685?source=mfp.
Seasonal Patterns Endure
Year to date the S&P 500 is up 12.1% as of the April 29 close. This is way above the historical averages and a rather encouraging sign that supports our outlook for a muted Worst Six Months manifesting in mostly sideways market action with limited shallow pullbacks and no major corrections. We had a superb question come up on the webinar about market behavior following first four months up more than 10%. We posted our findings on the blog and found that the previous 17 times since 1950 that the S&P 500 was up over 10% for the first four months preceded flat market performance from May to late-October.
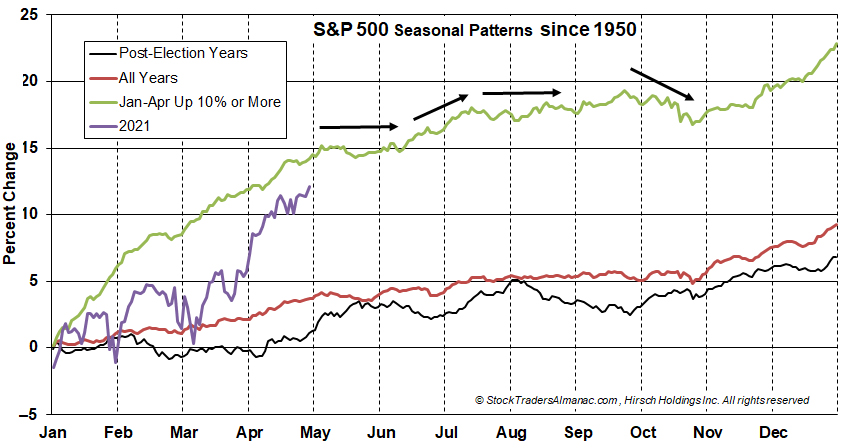
The chart here of the S&P 500 Seasonal Pattern overlaid with the years January-April were up more than 10% also highlights how well the market continues to track seasonals in 2021. The magnitude of gains is well above historic norms, but weakness in late February and late March as well as solid April strength are emblematic of typical seasonal market behavior.
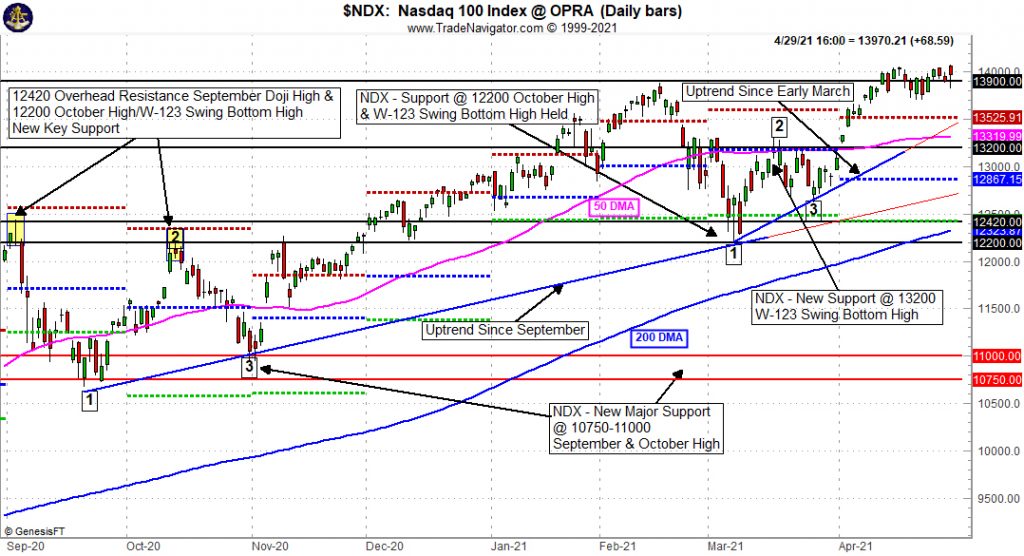
The market appears ripe for a pause and pullback following the extended up move we’ve had. Technically the charts of the indexes look toppy. The chart here of the NASDAQ 100 (NDX) we have been tracking shows the NDX stalling around our 13,900 resistance line. As discussed in the Market at a Glance below Market internal readings of Advancers/Decliners and New Highs/Lows also appear to be rolling over.
As the market’s prospects over the next several months look rather tame with little upside we will stick with the system. Now is the season to consider repositioning and shifting to a more neutral stance for the Worst Six Months. But our outlook remains bullish for the year as a whole.
The Fed continues to reaffirm its unrelenting support for the economy and its commitment to remain super accommodative. The market seems to be reacting well to President Biden’s first 100 days, his agenda and the plans he laid out in his April 28 address to a joint session of Congress. Despite several concerning global hotspots the Covid-19 pandemic does not appear to be impacting the market much anymore.
Now that folks in many countries are returning to normal they will likely be returning to more normal seasonal behaviors and taking time away from the market in the summer months. This should help facilitate the usual summer market doldrums of lighter volume and the usual tepid sideways action with minor pullbacks during the Worst Six Months May-October. This is the perfect time for some spring portfolio cleaning, reevaluating positions and some repositioning.
MAY
2021