
May officially marks the beginning of the “Worst Six Months” for the DJIA and S&P. To wit: “Sell in May and go away.” Our “Best Six Months Switching Strategy,” created in 1986, proves that there is merit to this old trader’s tale. A hypothetical $10,000 investment in the DJIA compounded to a gain of $1,008,519 for November-April in 68 years compared to just $1,031 for May-October. The same hypothetical $10,000 investment in the S&P 500 compounded to $720,389 for November-April in 68 years compared to a gain of just $10,066 for May-October.
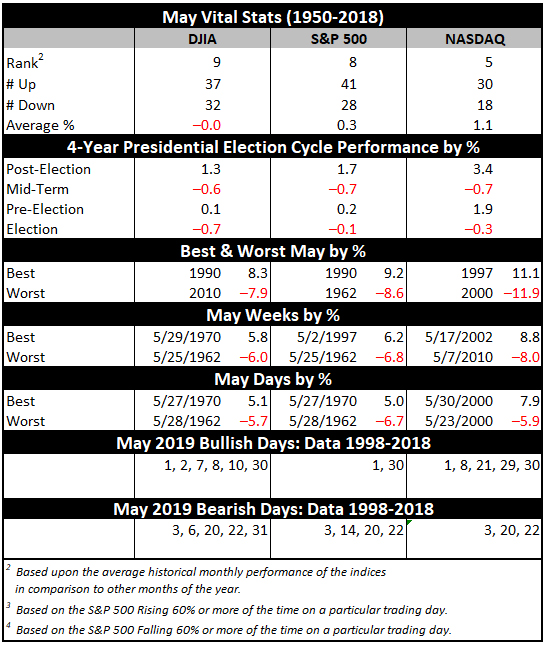
May has been a tricky month over the years, a well-deserved reputation following the May 6, 2010 “flash crash”. It used to be part of what we called the “May/June disaster area.” From 1965 to 1984 the S&P 500 was down during May fifteen out of twenty times. Then from 1985 through 1997 May was the best month, gaining ground every single year (13 straight gains) on the S&P, up 3.3% on average with the DJIA falling once and two NASDAQ losses.
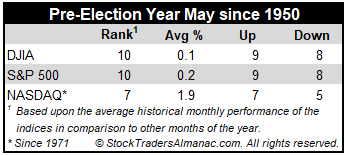
In the years since 1997, May’s performance has been erratic; DJIA up eleven times in the past twenty-one years (three of the years had gains in excess of 4%). NASDAQ suffered five May losses in a row from 1998-2001, down – 11.9% in 2000, followed by eleven sizable gains in excess of 2.5% and four losses, the worst of which was 8.3% in 2010. Since 1950, pre-election-year Mays rank poorly, #10 DJIA and S&P 500 and #7 NASDAQ.
Based upon the S&P 500, Monday before May option expiration is much stronger than expiration day itself. S&P 500 has registered only seven losses in the last thirty-one years on Monday. Expiration day is a loser nearly across the board. The full week had a bullish bias that has been fading in recent years. The week after options expiration week now favors NASDAQ. DJIA has fallen in eleven of the last twenty weeks after, while NASDAQ has been up in eleven of the last fifteen weeks after.
On Friday before Mother’s Day the DJIA has gained ground sixteen of the last twenty-four years and on the Monday after (the first day of options expiration this year), the blue-chip average has also risen in seventeen of those years.
The first two days of May trade higher frequently and the S&P 500 has been up 21 of the last 29 first trading days. A bout of weakness often appears on the third, fourth and around the fifteenth trading day for large cap stocks. Generally, the first half of the month is better than the second half.
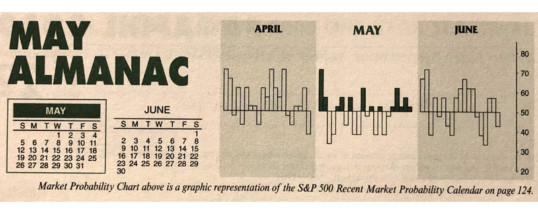
MAY
2019