

Stocks have gone virtually nowhere since Stock Trader’s Almanac April 22 Best Six Months MACD Seasonal Sell Signal. Trading volume has already begun to slowdown as it tends to do from Memorial Day to Labor Day in what we refer to as the summer doldrums. This reduction in trading volume (page 48, STA 2021) both contributes to and is emblematic of seasonal market weakness during the Worst Six Months May-October (page 147, STA 2021) and the Worst Four Months July-October (page 148, STA 2021).
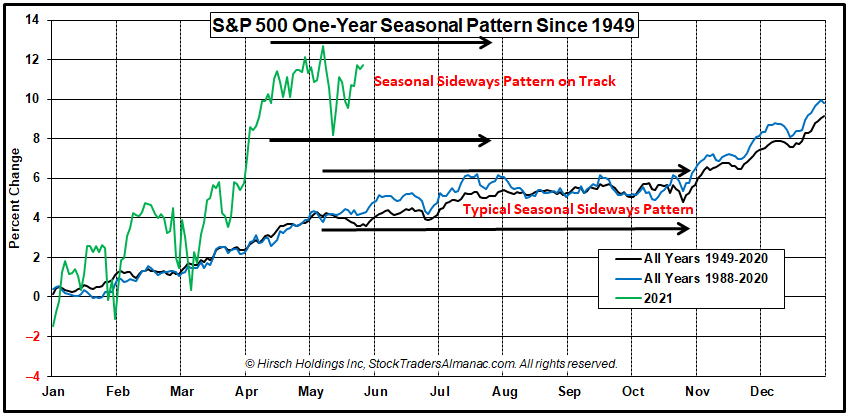
The market continues to follow seasonality albeit with a greater magnitude of gains this year and for the Best Six Months November-April than the average year. As you can see in the chart here of the S&P 500 comparing 2021 to the historical seasonal pattern we have also begun to track the typical sideways action the market experiences over the Worst Months of the year.
Several factors at play, especially during this unique post-COVID-19-pandemic, economic-reopening year, continue to support our near-term sideways market outlook on the backdrop of our overall bullish outlook for the year as a whole in keeping with the base and best case scenarios of our 2021 Annual Forecast. We still expect to see the S&P 500 finish the year above current levels in the 4300-4500 range, more in line with our best case scenario. In the near term, however, the market is primed to remain range-bound and bounce around between the April/May highs and the March lows.
The Fed’s still prudent accommodative stance will ensure the economic recovery is not undermined by a hasty response to transitory inflation pressures. This also helps keep a floor under the market – The Powell Put if you will. Fiscal spending from existing COVID-19 stimulus packages, a likely infrastructure spending package soon, as well as fiscal stimulus from G20 nations will also support the market. Further fundamental support comes from increased consumer spending, a healthy employment market and robust numbers from corporate America.
On the lid side of the equation folks are coming out of their pandemic shells in droves. This is great news for the travel industry, but it means that the usual summer exodus from The Street could potentially be more dramatic as people turn away from the market and turn towards visiting family they have not seen in over a year, vacations and all sorts of leisure activities.
Inflation fears, the slowing pace of vaccinations, troubling global COVID hotspots, technical resistance and rich valuations are also likely to keep market gains at bay over this seasonal weak period through Q3. Market rotation from the tech-oriented stay-at-home stocks into reopening stocks is also conspiring to hold back broad market gains until the summer travel seasons winds down.
End Best 8 Months
June 1 is the earliest the Stock Trader’s Almanac’s NASDAQ Seasonal Sell can trigger as NASDAQ’s Best Eight Months ends with June. When the signal triggers it is a good time to consider a more cautious stance. Historically, the Worst Four Months, July through October, have produced marginal average market gains with greater volatility. Tactical strategies that limit new buying, selectively reduce equity exposure, and hold cash and/or cash equivalent positions during the Worst Months may be better prepared to weather any market weakness that may manifest compared to more aggressive approaches.
June is a tough month for DJIA and S&P 500, but not so bad for NASDAQ and Russell 2000. This year June starts right after Memorial Day, which is not the most bullish post-holiday trade so, the usual strength on the first two trading days of June may be muted as folks get back into the swing of things after the long weekend.
Christmas in July: NASDAQ’s Mid-Year Rally
In the mid-1980s the market began to evolve into a tech-driven market and the market’s focus in early summer shifted to the outlook for second quarter earnings of technology companies. Over the last three trading days of June and the first nine trading days in July, NASDAQ typically enjoys a rally. This 12-day run has been up 28 of the past 36 years with an average historical gain of 2.6%.
After the bursting of the tech bubble in 2000, NASDAQ’s mid-year rally had a spotty track record from 2002 until 2009 with three appearances and five no-shows in those years. However, it has been quite solid over the last eleven years, up ten times with a single mild 0.1% loss in 2015. Last year, NASDAQ advanced a solid 4.7% during the 12-day span.
JUN
2021