
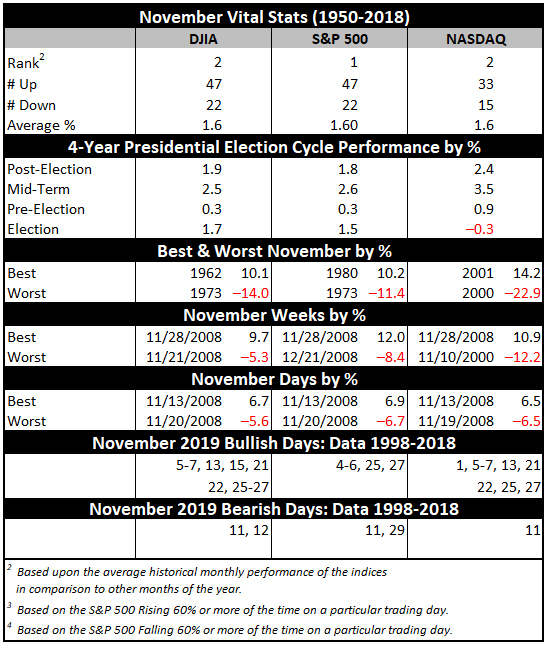
November maintains its status among the top performing months as fourth-quarter cash inflows from institutions drive November to lead the best consecutive three-month span November-January. However, the month has taken hits during bear markets and November 2000, down –22.9% (undecided election and a nascent bear), was NASDAQ’s second worst month on record—only October 1987 was worse.
November begins the “Best Six Months” for the DJIA and S&P 500, and the “Best Eight Months” for NASDAQ. Small caps come into favor during November, but don’t really take off until the last two weeks of the year. November is the number-two DJIA (since 1950) and NASDAQ (since 1971) month. November is best for S&P 500 (since 1950).
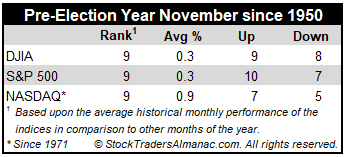
In pre-election years, November’s performance is noticeably weaker. DJIA has advanced in nine of the last 17 pre-election years since 1950 with an average gain of 0.3%. S&P 500 has been up in 10 of the past 17 pre-election years, also gaining on average a rather paltry 0.3%. Techs perform better with NASDAQ climbing in 7 of the last 12 pre-election year Novembers with an average 0.9% gain. Contributing to pre-election year November’s weaker performance are nasty declines in 1987, 1991 and 2007.
Being a bullish month November has five bullish S&P 500 days, though it does have weak points. NASDAQ exhibits the greatest strength at the beginning and end of November. Recent weakness around Thanksgiving has shifted DJIA and S&P 500 strength to mirror that of NASDAQ with the majority of bullish days at the beginning and end of the month. The best way to trade Thanksgiving is to go long into weakness the week before the holiday and exit into strength just before or after. DJIA has been up 19 of the last 26 weeks before Thanksgiving.
NOV
2019