

Despite scary trading on Halloween spooked by the latest trade and impeachment fears, the market has been rising steadily since our October 11 Seasonal Best Six Months MACD Buy Signal. Our defensive positions did well while the market gained little ground from our May 1st Sell Signal until our October 11 Buy Signal.
Now that we’ve survived Octoberphobia and the market has begun to strengthen again, breaking out above support and logging new highs on the S&P 500, we are likely to experience a bit of consolidation in November. Normally the top S&P month of the year and #2 for DJIA and NASDAQ, November is considerably weaker in Pre-Election Years.
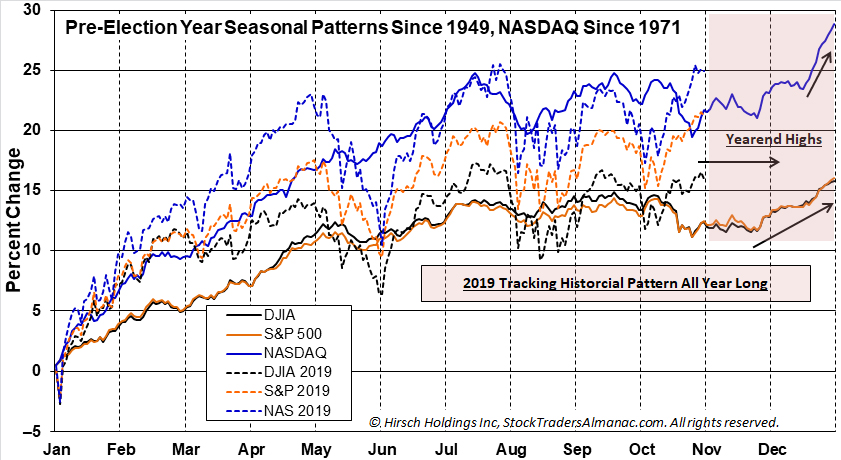
As you can see in the updated chart of Pre-Election Year Seasonal Patterns overlaid with 2019 we have been tracking all year November tends to be flat in the Pre-Election Year with a pop around Thanksgiving. Then after the usual first half of December softness the market tends to push toward additional new highs near yearend. Considering the banner performance so far this year and the uncanny tracking of this historical seasonal pattern, we expect the stock to consolidate over the next few weeks and then resume the march to new highs.
Technically, the market has a little work to do here to convert the old highs and resistance levels we discussed two months ago into support before we can comfortably move to new higher highs. Fundamentals are also encouraging with Q3 GDP and earnings numbers coming in better than expected, jobs data remaining strong and an accommodative Fed that appears to have effectively lowered rates in a mid-cycle adjustment.
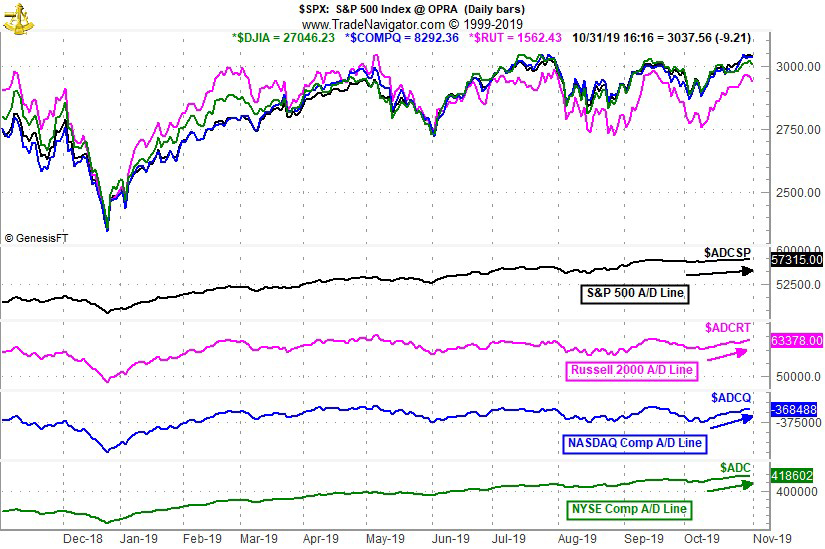
Market internals have also improved and most encouraging is the rising Advance-Decline Lines. Broad market participation is apparent in this chart of the S&P 500 in black, DJIA in green, NASDAQ in blue and the Russell 2000 in pink with their respective A/D Lines in the lower panes. For better perspective we’ve included the NYSE Composite A/D line in green instead of DJIA. S&P’s A/D Line leaves a little to be desired as it is not rising as steeply as the others.
So we have the Fed Put firmly underneath the market now after their relatively successful mid-cycle adjustment, seasonals and the 4-year election cycle at our backs, better than expected fundamentals, positive technicals and rising sentiment. The news on the impeachment proceedings and logistical snafus with phase one of the China trade deal are hanging over the market right now.
Expect the market to mark time as it often does in November of the Pre-Election as it digests the latest geopolitical machinations, before it makes a move at more new highs toward yearend.
NOV
2019