

Fed Chairman Powell and President Trump have been competing for who can freak the market out most. Our contention for months has been that the Fed is the biggest risk to the market and economy and that surely seems to have come home to roost the past few months and this week.
Last month in our “Market at a Glance” we said that, “After nearly a decade at zero, a brief pause to evaluate the impact of recent hikes does not seem unreasonable.” In addition to the continuing rate hikes is the impact of the Fed’s quantitative tightening program of reducing its balance sheet, which is equivalent to another ¼ or ½ point on the Fed Funds rate. We have not been the only ones saying this and perhaps Stanley Druckenmiller said it best in his Wall Street Journal piece in mid-December.
And in the face of this market selloff Chairman Powell refused to relent and pause to reflect. Perhaps he’s playing hardball with President Trump and wants to prove the Fed’s independence or perhaps he is just determined to raise rates as much as he can while the “labor market has continued to strengthen and” “economic activity has been rising at a strong rate,” in the Fed’s own words from the 12/19/18 FOMC Statement.
Either way his comments at his news conference that he expects to raise rates 2 more times in 2019, while the Fed’s growth forecasts for 2019 and beyond are for slower growth were not what the market wanted to here. Quarter point now and a pause to reflect would have been music to Wall Street’s ears.
President Trump’s own games of hardball with the Democrats over the “wall” and the funding bill to reopen the federal government open and the Chinese over fair trade spooked the market through most of Q4 2018. The market’s performance in Q4 was the exact opposite of historical averages. Higher interest rates, trade disputes and Brexit all appear to be weighing on the market. Tougher corporate earnings comparisons and slowing earnings growth are also hindering the market.
Technically the market is broken. As we warned on our blog December 17 we were flirting with disaster and when all three major U.S. market indices violated the early 2018 lows more selling ensued as there was little support below them. For now we seem to have found support way back at the August 2017 lows around Dow 21700, S&P 2425 and NASDAQ 6200.
If the U.S.-China trade negotiations move in a positive direction, the Fed tones down some of its more hawkish rhetoric and the federal government reopens with Dems and Reps working together more the market will be free to rally and bring the “official” Santa Claus Rally to Wall Street. So as we wind down this year of the return to volatility and more historically normal market action (2017 was an anomaly) our outlook is tempered, at least into early 2019. If our Santa Claus Rally can materialize that would be the first constructive sign, if not, we would expect more volatility.
Midterm Correction Sets Stage
The tax cut legislation held off the usual midterm year correction until much later in the year, pushing the potential low toward yearend and into 2019. But this bodes well for pre-election year 2019. If the market had kept chugging along to new highs, gains in 2019 would have been harder to come by.
Now that we have a sizeable correction and maybe a bit more downside in store, 2019 is setting up better than it was at the beginning of October. If the market has found support here or early in 2019, the Fed comes to its senses and the folks in D.C. can cut some deals more normal pre-election year gains can be expected.
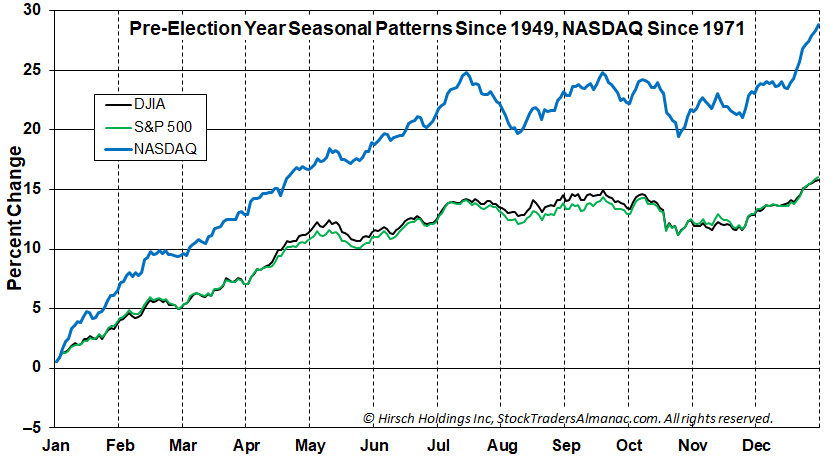
The third year of the 4-year presidential election cycle is still the strongest and now with the market hitting new 52-week lows the stage is set. For perspective have a look at the average 1-year seasonal patterns for the Dow, S&P 500 and NASDAQ in the chart below.
2019 Forecast
There is an increasing probability that we are in a bear market right now in the U.S. And if the U.S. market continues to behave as it has for the last few months, we could be down 20% on the Dow and S&P 500 in early 2019. The NASDAQ was down 23.6% on a closing basis at the 12/24/2018 close and S&P 500 was down 20% intraday from its high.
Taking into account the risks of heightened volatility, increasingly bearish sentiment, a more tepid fundamental outlook, a persistently hawkish Fed, an embattled Federal government as well as the bullish history of pre-election year markets and historical seasonal patterns we have once again laid out three scenarios for 2019:
• Worst Case – Prolonged bear market caused by hawkish Fed, dysfunctional Federal Government, slow growth and weak corporate fundamentals brings us all the way back to November 2016 pre-Trump election levels or lower. Repeat of pre-election year 2015 with the bear lasting throughout 2019 into 2020.
• Base Case – Something gives. Mild bear market bottoms soon or in early 2019 as Fed tones down rhetoric and holds off raising rates, Trump and the Dems work out a few deals and we have modest pre-election year gains in the 5-10% range.
• Best Case – Everything resolves quickly. Fed becomes accommodative. Trade deals are worked out expeditiously. Trump tacks towards the center and works with congress and does not get “Muellered.” Typical pre-election year gains of 10-15% for Dow and S&P 500 and 20-30% for NASDAQ
We will be keeping you fully abreast of all readings from out three January Trifecta Indicators: Santa Claus Rally, First Five Days and the full-month January Barometer and will make adjustments on the close of January 2019.
Happy Holidays & Happy New Year, we wish you all a healthy and prosperous 2019!
JAN
2019