
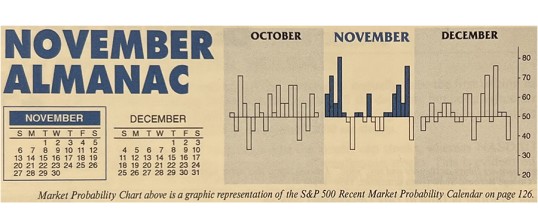
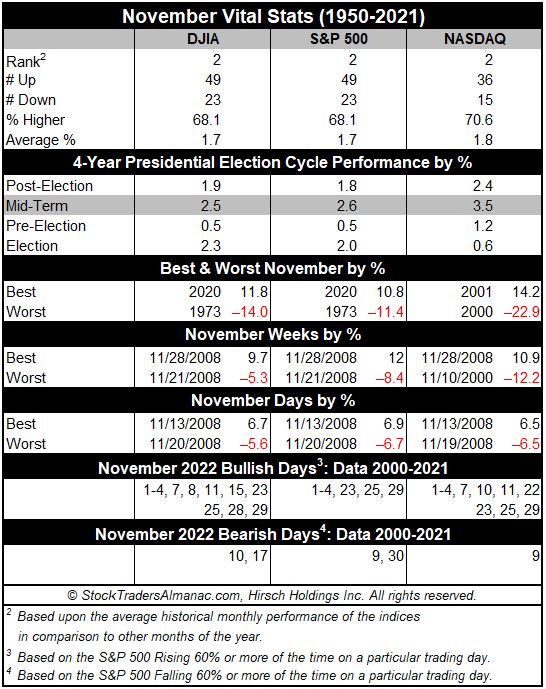
November maintains its status among the top performing months as fourth-quarter cash inflows from institutions drive November to lead the best consecutive three-month span November-January. However, the month has taken hits during bear markets and November 2000, down –22.9% (undecided election and a nascent bear), was NASDAQ’s second worst month on record—only October 1987 was worse.
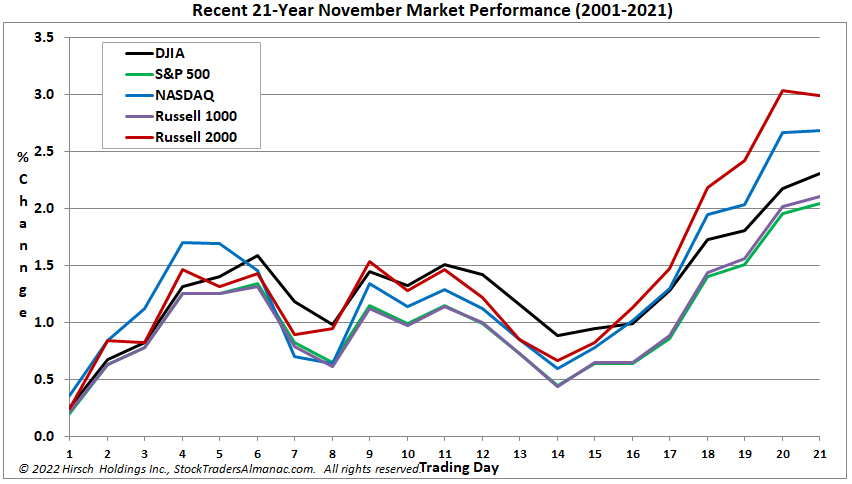
November begins the “Best Six Months” for the DJIA and S&P 500, and the “Best Eight Months” for NASDAQ. Small caps come into favor during November, but don’t really take off until the last two weeks of the year. November is the number-two DJIA, S&P 500 (since 1950), and NASDAQ (since 1971) month. November is best Russell 2000 (since 1979). Average performance in all year ranges from 1.7% from DJIA and S&P 500 to a solid 2.3% by Russell 2000.
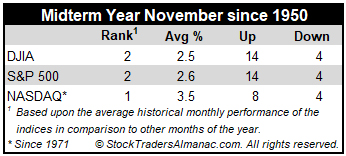
In midterm years, November’s market prowess is relatively unchanged. DJIA has advanced in 14 of the last 18 midterm years since 1950 with an average gain of 2.5%. S&P 500 has also been up in 14 of the past 18 midterm years, gaining on average 2.6%. Small caps perform well with Russell 2000 climbing in 7 of the past 10 midterm years, averaging 3.3%. The only real blemish in the November midterm-year record is 1974 (DJIA –7.0%, the final DJIA bear market bottom was in December).
Options expiration often coincides with the week before Thanksgiving. DJIA posted ten straight gains 1993-2002 and has been up 19 of the last 29 weeks before Thanksgiving but has been down the last five. The Monday of expiration week has been streaky, but the net result since 1994 is 17 DJIA gains in 28 years with 12 advances occurring in the last 18 years. Options expiration day has a bullish bias, up 14 of the last 20. The week after expiration has been a mixed bag recently. DJIA has been up six of the last ten after being down five of six from 2006 to 2011.
Being a bullish month November has seven bullish days based upon S&P 500, with four occurring on the first four trading days of the month. Although historically a bullish month, November does have weak points. NASDAQ and Russell 2000 exhibit the greatest strength at the beginning and end of November. Russell 2000 is notably bearish on the 12th trading day of the month; the small-cap benchmark has risen just ten times in the last 38 years (since 1984). The Russell 2000’s average decline is 0.35% on the day. Recent weakness around Thanksgiving has shifted DJIA and S&P 500 strength to mirror that of NASDAQ and Russell 2000 with the majority of bullish days at the beginning and end of the month. We believe the best way to trade Thanksgiving is to go long into weakness the week before the holiday and exit into strength just before or after.
NOV
2022