

It was encouraging for the S&P 500 to close above the big round 4000 number during the Thanksgiving week. Across-the-board gains in the major averages and sectors were also constructive. We believe reclaiming 4000 and then the 200-day moving average would be supportive. We remain bullish on the yearend rally and the prospect for continuing gains into 2023, but not without concerns for the headwinds the market faces from inflation, Fed rate hikes, geopolitics and further fallout from the crypto crumble.
We have entered the most bullish time of the year, the Best Six Months (November-April) and the most bullish time of the 4-Year Cycle, the “Sweet Spot” from Q4 midterm year to Q2 pre-election year. We are encouraged by the prototypical midterm election year bear market we have already suffered and what looks like a classic October bottom.
The market is still trying to recover from the technical damage while the economy recovers from some structural damage. So, while we expect further upside in December and next year, we suspect it will come with ups, downs and sideways along the way as it climbs the proverbial Wall of Worry.
Tempered Yearend Gains When S&P Down YTD Thanksgiving
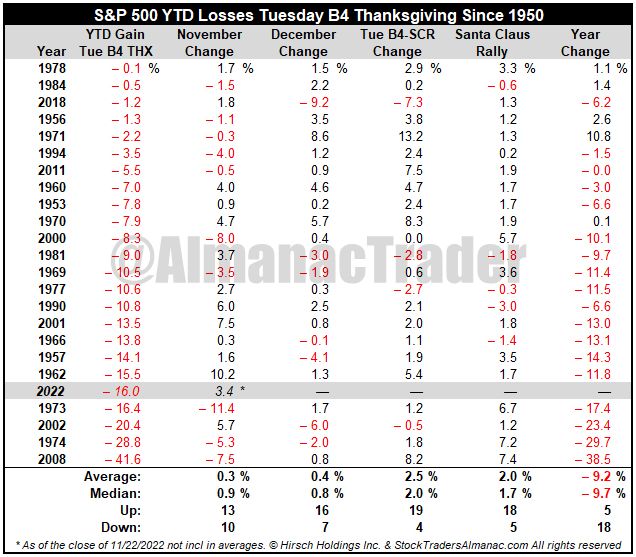
Last year at this time on the Tuesday before Thanksgiving S&P 500 was up 24.9% year-to-date. November 2021 gave back a fractional loss, but December and the Santa Claus Rally delivered solid gains. But then the stuff hit the fan. Inflation became non-transitory, the Fed began tapering asset purchases and telegraphing imminent rate hikes, Russia invaded Ukraine and the bear came out of hibernation.
This year on the Tuesday before Thanksgiving the market was in an entirely different situation with S&P down -16.0% YTD. The table here shows how the market claws its way back in most years with fewer but sizable losses bringing the averages down. The fact that November 2022 is up so far is supportive for continued upside. What stands out to us in this table is the rather solid performance for the Tuesday before Thanksgiving-Santa Claus Rally trade as well as solid gains for the Santa Claus Rally itself.
If Santa Claus Should Fail to Call…
And that brings us to the rather full seasonal docket for December. It is important to remember that while it is the most bullish time of the year there are weak spots and early December is one of them.
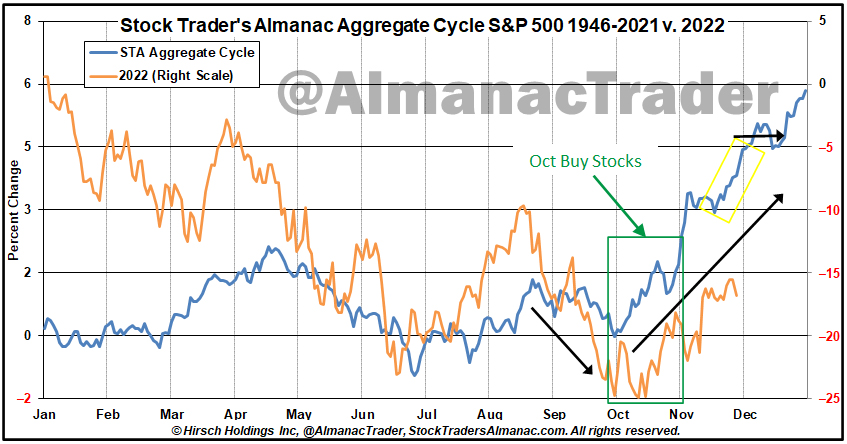
In the updated STA Aggregate Cycle graph, it is encouraging to see the S&P 500 in 2022 (orange line) continue to track the trend of this cycle which is an aggregate since 1946 of all years, midterm years and years ending in “2”. At this juncture we remain on track for a rally into the end of November and the first few days of December before tax-loss selling ramps up, of which there should be plenty this year, driving stocks lower into mid-December.
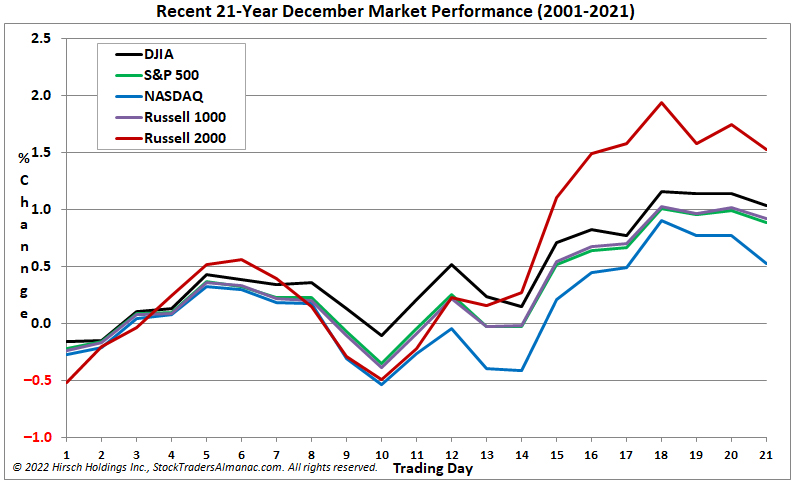
Then the “January Effect” (small caps outperforming large caps in the month of January) has historically kicked in. These days most of the so-called January Effect takes place in the last half of December (2023 Almanac pages 112 & 114). The January Effect is not to be confused with the January Barometer (2023 Almanac page 18), which states as the S&P 500 goes in January, so goes the year. January’s gains in general for all the major averages have been pulled forward into December, but the Russell 2000 takes the lead as you can see in the Recent 21-Year December Market Performance chart.
The Santa Claus Rally was defined by Yale Hirsch in 1972 as the last five trading days of the year and the first two trading days of the New Year. This short, sweet rally is usually good for about 1.3% on the S&P 500, but the real significance of the SCR is as an indicator.
It is our first seasonal indicator of the year ahead. Years when there was no Santa Claus Rally (SCR) tended to precede bear markets or times when stocks hit significantly lower prices later in the year. We get an even better indication of the New Year when we combine SCR with the First Five Days (FFD) Early Warning System (2023 Almanac page 16) and the full-month January Barometer (JB) reading. Stock Trader’s Almanac calls this the “January Indicator Trifecta.”
When all three are up the S&P 500 has been up 90% of the time, 28 of 31 years, with an average gain of 17.5%. When any of them are down the year’s results are reduced and when all three are down the S&P was down 3 of 8 years with an average loss of -3.6% with bear markets in 1969 (-11.4%), 2000 (-10.1%) and 2008 (-38.5%), flat years in 1956 (2.6%), 1978 (1.1%) and 2005 (3.0%). Down Trifectas were followed by gains in 1982 (14.8%) and 2016 (9.5%). This year SCR was up but the FFD and full month JB were down, and it was a valuable bearish indication for this year.
In the absence of a major systemic event in the market from crypto or somewhere else, or a serious escalation in the Ukraine war, or some extremely hawkish shift from the Fed or an economic surprise, we expect stocks to continue to move higher with some down and sideways moves mixed in as it climbs the Wall of Worry in this nascent bull market. We will want to see more progress in reclaiming the down trend. Having the S&P 500 reclaim its 200-day moving average would be a good start. Then some improvement in market internals.
For now, it appears to us that inflation may have peaked and is trending lower with three consecutive lower readings. According to the Atlanta Fed’s reliable GDPNow Q4 GDP is estimated to be over 4%. And with the Fed Funds Target Rate Upper Limit at 4% and the latest FOMC dot plot upper range at 5% we can surmise the Fed is near the end of the tightening cycle. So, we remain cautiously bullish.
NOV
2022