Posts Tagged 'S&P 500'

Almanac Update May 2018: Start of “Worst Six Months” for DJIA and S&P 500

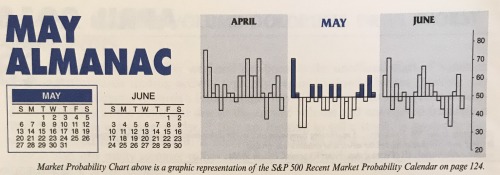
May officially marks the beginning of the “Worst Six Months” for the DJIA and S&P. To wit: “Sell in May and go away.” May has been a tricky month over the years, a well-deserved reputation following the May 6, 2010 “flash crash”. It used to be part of the “May/June disaster area.” From 1965 to 1984 the S&P 500 was down during May fifteen out of twenty times. Then from 1985 through 1997 May was the best month, gaining ground ...

Continue Reading →
0

Market Outlook May 2018: Worst Six Months, Crueler In Midterm Years, Begins

As the market is finally making a rally attempt at the end of April, the last month of the Best Six Months” we are obligated to remind you that the “Worst Six Months” are now upon us, and as we pointed out last month this bearish seasonal stretch has been more pronounced in midterm years.

For the near term over the next several weeks the rally may have some legs. But as we get into the summer doldrums ...

Continue Reading →
0

Seasonal Research April 2018: April’s Option Expiration Week Historically Bullish

April option expiration is generally bullish across the board with solid gains on the last day of the week, the entire week and the week after. Since 1982, DJIA and S&P 500 have both advanced 23 times in 36 years on expiration day with an average gain of just under 0.2%. Expiration week as a whole has a slightly more bullish track record over the past 36 years to expiration day. Average weekly gains are 1% or better for S&P ...

Continue Reading →
0

February 2018 Market at a Glance

Seasonal:

Bullish. Even though February’s long-term record has been spotty, DJIA has advanced for eight straight February’s while S&P 500 have been up in seven of the last eight. In midterm years, February’s performance has been above average, DJIA and NASDAQ +1.0%, S&P 500 +0.7%. However, February’s following big January’s (+4% or more) have declined or finished with a less than ...

Continue Reading →
0

Almanac Update February 2018: Big January Gains Correct or Consolidate in February

February tends to follow the current trend, though big January gains often correct or consolidate during the month of Valentines and Presidents as Wall Street evaluates and adjusts market outlooks based on January’s performance. Since 1950, January S&P 500 gains of 2% or more corrected or consolidated in February 62.1% of the time. In the 20 years that the S&P 500 gained 4% or more in January, 65.0% of the time the S&P declined or finished flat (less than 1% ...

Continue Reading →
0

Almanac Update January 2018: Results from Trio of Indicators Could Reshape 2018

January has quite a legendary reputation on Wall Street as an influx of cash from yearend bonuses and annual allocations typically propels stocks higher. January ranks #1 for NASDAQ (since 1971), but sixth on the S&P 500 and DJIA since 1950. It is the end of the best three-month span and possesses a full docket of indicators and seasonalities.

In midterm years, January ranks near the bottom since 1950. Large-caps have been the worst with S&P 500 and Russell 1000 ranking ...

Continue Reading →
0
Page 19 of 19 «...101516171819