Author Archive

May 2020 Market at a Glance

Seasonal:

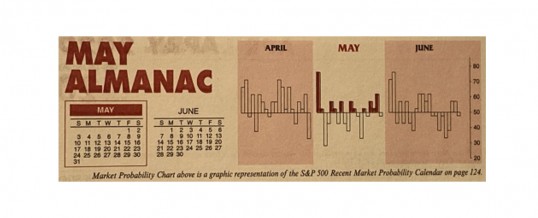
Neutral. May is the first month of DJIA and S&P 500 “Worst Six Months. Our Seasonal MACD Sell signal has not triggered yet suggesting the rally could continue in the near-term. The history of “Worst Six Months” after a bad “Best Months” is not encouraging. This year’s negative January Barometer and breached December DJIA low, point to possible retest ...

Continue Reading →
0

Almanac Update May 2020: Weaker in Election Years

May officially marks the beginning of the “Worst Six Months” for the DJIA and S&P. To wit: “Sell in May and go away.” Our “Best Six Months Switching Strategy,” created in 1986, proves that there is merit to this old trader’s tale. A hypothetical $10,000 investment in the DJIA compounded to a gain of $1,068,826 for November-April in 69 years compared to just $1,461 for May-October. The same hypothetical $10,000 investment in the S&P 500 compounded to $823,326 for November-April ...

Continue Reading →
0

April 2020 Outlook: Beware the Bear Market Bounce

The Dow’s 6.4% rally on March 26 capped the biggest three-day surge since October 6-8, 1931. That may sound encouraging, but remember 1931 was the worst year for DJIA on record, down 52.7%. DJIA jumped 21.3% from the low on Monday March 23. This surge came on the heels of the fastest and most furious decline in stock market history. DJIA dropped 37.1% from its 2/12/2020 all-time high in 40 calendar days. It fell 35.9% in 31 days from the ...

Continue Reading →
0

April 2020 Market at a Glance

Seasonal:

Bullish. April is DJIA’s best performing month since 1950, second best for S&P and fourth best for NASDAQ (since 1971). However, April also marks the end of our “Best Six Months” for DJIA and the S&P 500. Our Seasonal MACD Sell signal can occur as early as April 1 but could easily be delayed should the market continue to recover ...

Continue Reading →
0

Almanac Update April 2020: Can Top Month Curtail Market Rout?

The first trading day of April and the second quarter, has enjoyed notable strength over the past 25 years, advancing 18 times with an average gain of 0.40% in all 25 years for S&P 500. However, four of the seven declines have occurred in the last seven years. Other declines were in 2001, 2002 and 2005. DJIA’s record on April’s first trading day matches the S&P 500, 18 advances in 25 years. NASDAQ recent performance is slightly weaker than DJIA ...

Continue Reading →
0

March 2020 Outlook: Coronavirus Fears Grip Wall Street

The Dow Jones Industrial Average suffered its worst one-day point loss on February 27. The market was down all day, but fluctuated dramatically with the headlines. Widespread selling pushed the market into correction territory with the Dow down 12.8% from its February 12 all-time high as of the close on February 27. S&P 500 and NASDAQ are down 12.0% and 12.7% from their respective February 19 all-time highs.

At 8 calendars days long (6 trading days), this is the fastest 10% ...

Continue Reading →
0

March 2020 Market at a Glance

Seasonal:

Bullish. Normally a decent performing market month, March is above average in election years with advances 64.7% of the time with a 1.0% average DJIA gain since 1952. S&P 500 has also advanced 64.7% of the time since 1952, but gains have been slightly better at 1.2%, on average. NASDAQ has not fared well in March in election years since ...

Continue Reading →
0

Almanac Update March 2020: Beware the Ides & Month-End Weakness

Boisterous March markets tend to drive prices up early in the month and batter stocks at month end. Julius Caesar failed to heed the famous warning to “beware the Ides of March” but investors have been served well when they have. Stock prices have a propensity to decline, sometimes rather precipitously, during the latter days of the month. In March 2001, DJIA plunged 1469 points (-13.5%) from March 9 to the 22.

March packs a rather busy docket. It is the ...

Continue Reading →
0

Almanac Update February 2020: Can be Challenging in Election Years

Even though February is right in the middle of the Best Six Months, its long-term track record, since 1950, is rather tepid. February ranks no better than eighth and has posted meager average gains. Small cap stocks, benefiting from “January Effect” carry over; tend to outpace large cap stocks in February. The Russell 2000 index of small cap stocks turns in an average gain of 1.2% in February since 1979—just the sixth best month for that benchmark.

A strong February in ...

Continue Reading →
0
Page 7 of 16 «...56789...»