Author Archive

August 2020 Market at a Glance

Seasonal:

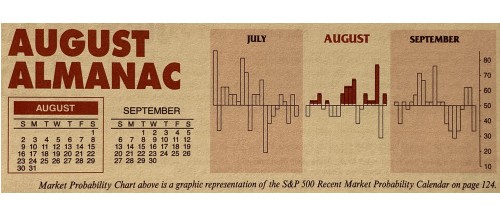
Neutral. August has been the worst DJIA, S&P 500 and NASDAQ month of the year since 1988. However, August’s track record in election years since 1950 (DJIA & S&P 500) or 1971 (NASDAQ) is much better. Average election year August performance ranges from 0.7% by DJIA to 3.3% for Russell 2000 (since 1979). This election year could be different since the ...

Continue Reading →
0

August 2020 Outlook: Pandemic, GDP & Election Jeopardize Rally

In mid-July the market was shrugging off pandemic setbacks, bleak economic and corporate outlooks, geopolitical tensions, civic unrest and a contentious U.S. presidential election battle with NASDAQ hitting a new all-time high and S&P 500 at a new recovery high. In fact we were looking at a classic “Hot July” pattern with DJIA up 4.6% for the month as of the close on July 22.

Gains of this magnitude for July, however, have frequently been followed by ...

Continue Reading →
0

Almanac Update August 2020: Top Month in Election Years for Tech & Small Caps

Money flows from harvesting made August a great stock market month in the first half of the Twentieth Century. It was the best month from 1901 to 1951. In 1900, 37.5% of the population was farming. Now that less than 2% farm, August is amongst the worst months of the year. It is the worst DJIA, S&P 500, NASDAQ, Russell 1000 and Russell 2000 month over the last 32 years, 1988-2019 with average declines ranging from 0.1% by NASDAQ to ...

Continue Reading →
0

Almanac Update July 2020: Not Much Sizzle in Election Years

July historically is the best performing month of the third quarter however, the mostly negative results in August and September tend to make the comparison easy. Two “hot” Julys in 2009 and 2010 where DJIA and S&P 500 both gained greater than 6% and a strong performance in 2013 and 2018 have boosted July’s average gains since 1950 to 1.2% and 1.1% respectively. Such strength inevitability stirs talk of a “summer rally”, but beware the hype, as it has historically ...

Continue Reading →
0

July 2020 Outlook: Climbing COVID Cases Threaten Rally

Climbing COVID cases and confusion about reopening the economy continues to confound the market. Even though hard working people and prudent businesses around the country are working diligently to reopen and safely serve clients and customers the increase in positive tests and hospitalization nationally is hard for the market to ignore.

Waiters are reminding diners to done their masks when ordering. Folks are waiting for the next elevator and not crowding in and business have hand sanitizer at the ready for ...

Continue Reading →
0

July 2020 Market at a Glance

Seasonal:

Neutral. July is the best month of the third quarter, but bulk of gains are in first half of month. July is historically weaker in election years. NASDAQ’s midyear rally lasts until July 14 this year. July is the first month of NASDAQ’s “Worst Four Months” and the third month of DJIA & S&P 500 “Worst Six Months.”

Continue Reading →
0

June 2020 Market at a Glance

Seasonal:

Neutral. June is the last month of NASDAQ’s “Best Eight Months.” DJIA and S&P 500 “Best Six Months” has already ended. NASDAQ’s Seasonal MACD Sell Signal can trigger as soon as the close on June 1. June has performed better in Election Years, second best S&P 500 month, #5 DJIA, #4 NASDAQ and Russell 2000.

Continue Reading →
0

June 2020 Outlook: Rally Set to Pause at End of Best 8 Months

Our Best Six Months Seasonal MACD Sell Signal for DJIA and S&P 500 triggered on May 13 when this recovery rally took a brief pause. The rally then resumed adding to May’s gains and putting NASDAQ back in the black for the year and up 5.8% year-to-date on the close of May. But the market is bumping into some resistance here technically and looks set to pause again and pullback to recent support levels.

Continue Reading →

0

Almanac Update June 2020: End of NASDAQ’s “Best Eight Months”

June has shone brighter on NASDAQ stocks over the last 49 years as a rule ranking seventh with a 0.8% average gain, up 27 of 49 years. This contributes to NASDAQ’s “Best Eight Months” which ends in June. June ranks near the bottom on the Dow Jones Industrials just above September since 1950 with an average loss of 0.2%. S&P 500 performs similarly poorly, ranking tenth, but essentially flat (0.1% average gain). Small caps also tend to fare well in ...

Continue Reading →
0

May 2020 Outlook: Down “Best Six Months” Warning Sign

Despite the selloff on the last day of April, the Best Six Months ended on a positive note, registering the best month in decades and the best April since the Great Depression. We have been tracking our Seasonal Best Six Months MACD Sell Signal for DJIA and S&P 500 since April 1. The slower MACD Sell indicator turned positive March 26 and remains in an uptrend and has not issued a new sell signal yet. At this point it would ...

Continue Reading →
0
Page 6 of 16 «...45678...»