
The first trading day of April and the second quarter, has enjoyed notable strength over the past 25 years, advancing 18 times with an average gain of 0.40% in all 25 years for S&P 500. However, four of the seven declines have occurred in the last seven years. Other declines were in 2001, 2002 and 2005. DJIA’s record on April’s first trading day matches the S&P 500, 18 advances in 25 years. NASDAQ recent performance is slightly weaker than DJIA and S&P 500, but the day is still bullish for technology stocks in general with more advances than declines during the same period.
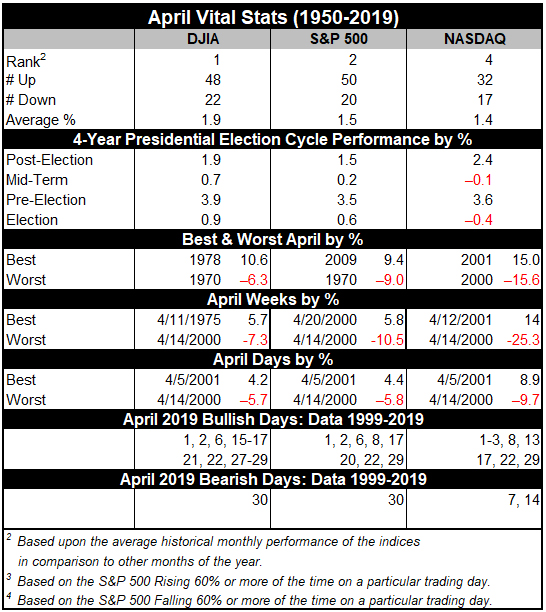
April marks the end of the “Best Six Months” for DJIA and the S&P 500. The window for the seasonal MACD sell signal opens on April 1st. The unprecedented speed of the current market selloff and current bear market would appear to have made this year’s signal insignificant. This could be the case, but it is far too early to say if the worst of the bear market is over. Double-digit DJIA losses during the “Best Six Months” have only occurred three times (ending in April in 1970, 1974 and 2009) since 1950. In 1970 & 2009 the “Worst Six Months” were positive while in 1974 DJIA slide another 20.5%.
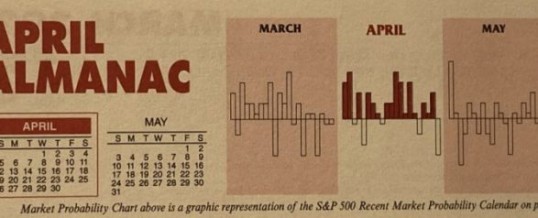
April 1999 was the first month to gain 1000 DJIA points. However, from 2000 to 2005, “Tax” month was hit, declining in four of six years. Since 2006, April has been up fourteen years in a row with an average gain of 2.3% to reclaim its position as the best DJIA month since 1950. April is second best for S&P and fourth best for NASDAQ (since 1971).
The first half of April used to outperform the second half, but since 1994 that has no longer been the case. The effect of April 15 Tax Deadline appears to be diminished with numerous bullish days present on either side of the day. Traders and investors are clearly focused on first quarter earnings and guidance during April. This year, guidance will likely be the greatest focus, as first and second quarter earnings are likely to be disappointing as a result of the coronavirus pandemic.
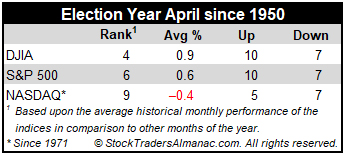
Historically bullish election-year influences (the second-best year of the four-year presidential election cycle) have the exact opposite effect on April. Average gains since 1952 are approximately half of the average gain of all years since 1950 for DJIA and S&P 500. Largely due to a 15.6% loss in 2000, NASDAQ’s typical strength in all Aprils since 1971 is transformed into an average loss in election years.
Good Friday (as well as Passover and Easter) lands a week before April’s option expiration week this year. Historically the longer-term track record of Good Friday (page 100 of STA 2020) is bullish with notable average gains by DJIA, S&P 500 and NASDAQ on the trading day before. NASDAQ has advanced 18 of the last 19 days before Good Friday. Monday, the day after Easter has exactly the opposite record and is in the running for the worst day after of any holiday. Since 2004 the day after has improved.
APR
2020