Posts Tagged 'Worst Six Months'

July 2021 Outlook: Midyear Rally Yields To Doldrums Mid-July

The rotation back into tech and growth stocks has picked up momentum on the prospects that recent rampant inflation fears are a bit overblown. The retreat in Treasury bond yields and the more tranquil bond market suggests the spike in prices is more transitory than the extremes some market observers and investors have been suggesting. In turn, NASDAQ’s midyear rally appears to be running ahead of schedule.

We remain in the transitory inflation camp. Sure it will likely ...

Continue Reading →
0

Almanac Update July 2021: Best Month of Post-Election Years

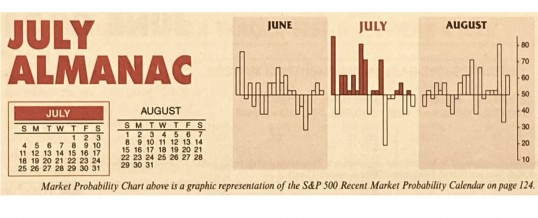
July historically is the best performing month of the third quarter however, the mostly negative results in August and September tend to make the comparison easy. Two “hot” Julys in 2009 and 2010 where DJIA and S&P 500 both gained greater than 6% and strong performances in 2013 and 2018 have boosted July’s average gains since 1950 to 1.3% and 1.1% respectively. Such strength inevitability stirs talk of a “summer rally”, but beware the hype, as it has historically been ...

Continue Reading →
0

June 2021 Outlook: NASDAQ Best 8 Months Ends – Sideways Summer Trading

Stocks have gone virtually nowhere since Stock Trader’s Almanac April 22 Best Six Months MACD Seasonal Sell Signal. Trading volume has already begun to slowdown as it tends to do from Memorial Day to Labor Day in what we refer to as the summer doldrums. This reduction in trading volume (page 48, STA 2021) both contributes to and is emblematic of seasonal market weakness during the Worst Six Months May-October (page 147, STA 2021) and the Worst Four Months July-October ...

Continue Reading →
0

Almanac Update June 2021: Second Worst DJIA Month in Post-Election Years

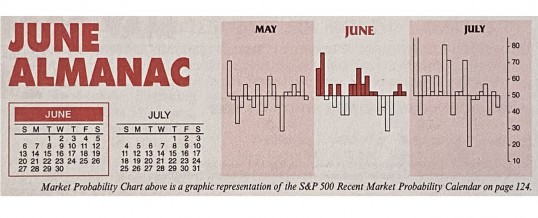
June has shone brighter on NASDAQ stocks over the last 50 years as a rule ranking sixth with a 0.9% average gain, up 28 of 50 years. This contributes to NASDAQ’s “Best Eight Months” which ends in June. June ranks near the bottom on the Dow Jones Industrials just above September since 1950 with an average loss of 0.2%. S&P 500 performs similarly poorly, ranking ninth, but essentially flat (0.1% average gain). Small caps also tend to fare well in ...

Continue Reading →
0

May 2021 Outlook: Muted Market Action Anticipated Over Worst Six Months

Seasonality remains back to normal and it appears from all our observations that it will continue to track historical patterns for the remainder of the year. April’s solid returns across the board led by S&P 500 (up 5.2%) and NASDAQ (up 5.4%) and new highs for DJIA, S&P 500 and NASDAQ capped off a banner Best Six Months. DJIA is up 27.8%, S&P 500 is up 27.9%, NASDAQ is up 28.0% and the Russell 2000 is up an amazing 47.3% ...

Continue Reading →
0

April 2021 Outlook: Late-March Weakness Sets Up End of Best Six Months Rally

The last month of our “Best Six Months” is now upon us. So it’s the perfect time to provide a refresher for longtime readers and primer for those that have recently joined us. We do not simply “Sell in May and go away.” We employ a more nuanced and subtle approach to how we implement our Best & Worst Months Switching Strategies detailed in the annual Stock Trader’s Almanac and on www.stocktradersalmanac.com. We are Continue Reading →

0

Almanac Update January 2021: An Indicator Trifecta Historically Bullish

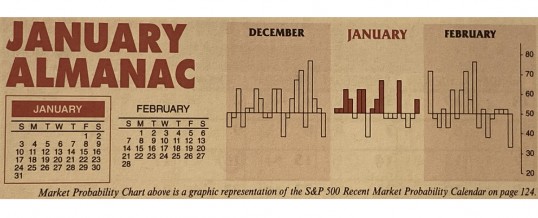
January has quite a reputation on Wall Street as an influx of cash from yearend bonuses and annual allocations has historically propelled stocks higher. January ranks #1 for NASDAQ (since 1971), but fifth on the S&P 500 and sixth for DJIA since 1950. January is the last month of the best three-month span and holds a full docket of indicators and seasonalities.

DJIA and S&P rankings did slip from 2000 to 2016 as both indices suffered losses in ten of those ...

Continue Reading →
0

Almanac Update December 2020: Small Caps Shine and Santa Visits Wall Street

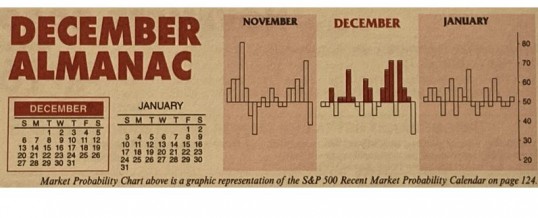
December is now the number three S&P 500 and Dow Jones Industrials month since 1950, averaging gains of 1.5% on each index. It’s the top Russell 2000 (1979) month and third best for NASDAQ (1971). In 2018, DJIA suffered its worst December performance since 1931 and its fourth worst December going all the way back to 1901. However, the market rarely falls precipitously in December and a repeat of 2018 is not highly likely. When December is down it is ...

Continue Reading →
0

Almanac Update November 2020: Top S&P 500 and DJIA Month in Election Years

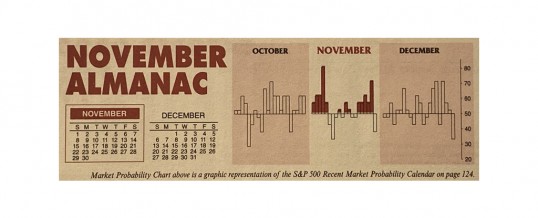
November is still maintaining its status among the top performing months as fourth-quarter cash inflows from institutions drive November to lead the best consecutive three-month span November-January. However, the month has taken hits during bear markets and November 2000, down –22.9% (undecided election and a nascent bear), was NASDAQ’s second worst month on record—only October 1987 was worse.

November begins the “Best Six Months” for the DJIA and S&P 500, and the “Best Eight Months” for NASDAQ. Small caps come into ...

Continue Reading →
0

Almanac Update October 2020: Worst Month of Election Year

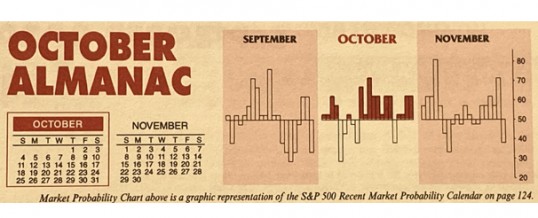
October often evokes fear on Wall Street as memories are stirred of crashes in 1929, 1987, the 554-point drop on October 27, 1997, back-to-back massacres in 1978 and 1979, Friday the 13th in 1989 and the 733-point drop on October 15, 2008. During the week ending October 10, 2008, Dow lost 1,874.19 points (18.2%), the worst weekly decline in our database going back to 1901, in percentage terms. March 2020 now holds the dubious honor of producing the worst, second ...

Continue Reading →
0
Page 2 of 3 123