Author Archive

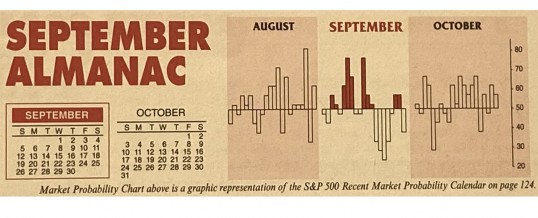
September 2021 Market at a Glance

Seasonal:

Bearish. September is the worst DJIA, S&P 500, NASDAQ, Russell 1000 and Russell 2000 month. Average declines range from –0.4% from Russell 2000 to –0.7% by DJIA. In post-election years since 1950, September is still ranked no higher than #9 while average performance remains negative with only a modest improvement.

Continue Reading →
0

Almanac Update September 2021: Worst Month of Year Over Last 71 Years

Start of the business year, end of summer vacations, and back to school once made September a leading barometer month in the first 60 years of 20th century, now portfolio managers back after Labor Day tend to clean house. Since 1950, September is the worst performing month of the year for DJIA, S&P 500, NASDAQ (since 1971), Russell 1000 and Russell 2000 (since 1979). After four solid years from 1995-1998 during the dot.com bubble buildup, S&P 500 was down five ...

Continue Reading →
0

August 2021 Outlook: Rally Primed To Pause in Worst Months

Our outlook for the full year remains clearly bullish, more in line with the best cast scenario of our Annual Forecast in the January 2021 issue. S&P 500 is already up about 17% so far this year at the end of July. Our updated outlook is for S&P 500 to finish the year in the 4500-4600 range or even higher, but we do anticipate the rally to pause over the next 2-3 months during the worst two ...

Continue Reading →
0

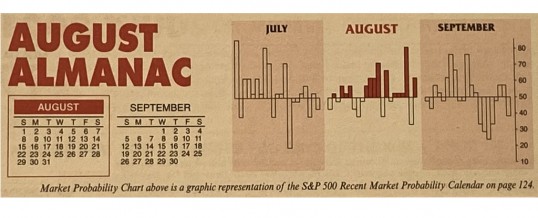
August 2021 Market at a Glance

Seasonal:

Bearish. August is the worst DJIA and S&P 500 month during 1988-2020 and second worst for NASDAQ. In post-election years since 1950, August is still ranked no higher than #11 while average performance slips deeper into negative territory. The Summer Volume Doldrums historically span all of August as traders and investors escape the office and head out on vacations.

Continue Reading →
0

Almanac Update August 2021: Challenging Month in Post-Election Years

Money flows from harvesting made August a great stock market month in the first half of the Twentieth Century. It was the best month from 1901 to 1951. In 1900, 37.5% of the population was farming. Now that less than 2% farm, August is amongst the worst months of the year. It is the worst DJIA, S&P 500, and Russell 2000 month over the last 33 years, 1988-2020 with average declines ranging from 0.4% by Russell 2000 to 0.8% by ...

Continue Reading →
0

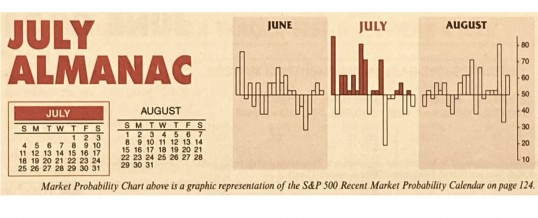
July 2021 Market at a Glance

Seasonal:

Neutral. July is the first month of the second half of the year and has the most bullish record in Q3. Post-election-year Julys rank #1 for DJIA, S&P 500 and NASDAQ. But July is also the first month of NASDAQ’s “Worst Four Months” and early July strength has a tendency to fade around mid-month. NASDAQ’s Mid-Year Rally ends on the ...

Continue Reading →
0

July 2021 Outlook: Midyear Rally Yields To Doldrums Mid-July

The rotation back into tech and growth stocks has picked up momentum on the prospects that recent rampant inflation fears are a bit overblown. The retreat in Treasury bond yields and the more tranquil bond market suggests the spike in prices is more transitory than the extremes some market observers and investors have been suggesting. In turn, NASDAQ’s midyear rally appears to be running ahead of schedule.

We remain in the transitory inflation camp. Sure it will likely ...

Continue Reading →
0

Almanac Update July 2021: Best Month of Post-Election Years

July historically is the best performing month of the third quarter however, the mostly negative results in August and September tend to make the comparison easy. Two “hot” Julys in 2009 and 2010 where DJIA and S&P 500 both gained greater than 6% and strong performances in 2013 and 2018 have boosted July’s average gains since 1950 to 1.3% and 1.1% respectively. Such strength inevitability stirs talk of a “summer rally”, but beware the hype, as it has historically been ...

Continue Reading →
0

June 2021 Market at a Glance

Seasonal:

Neutral. June is the last month of NASDAQ’s “Best Eight Months” and the second month of DJIA’s and S&P 500’s “Worst Six Months.” In post-election years, June is second worst for DJIA and third worst for S&P 500. NASDAQ and Russell 2000 have been stronger with average gains of 0.4% and 1.2% respectively.

Continue Reading →
0

June 2021 Outlook: NASDAQ Best 8 Months Ends – Sideways Summer Trading

Stocks have gone virtually nowhere since Stock Trader’s Almanac April 22 Best Six Months MACD Seasonal Sell Signal. Trading volume has already begun to slowdown as it tends to do from Memorial Day to Labor Day in what we refer to as the summer doldrums. This reduction in trading volume (page 48, STA 2021) both contributes to and is emblematic of seasonal market weakness during the Worst Six Months May-October (page 147, STA 2021) and the Worst Four Months July-October ...

Continue Reading →
0
Page 2 of 16 12345...»