

Our outlook for the full year remains clearly bullish, more in line with the best cast scenario of our Annual Forecast in the January 2021 issue. S&P 500 is already up about 17% so far this year at the end of July. Our updated outlook is for S&P 500 to finish the year in the 4500-4600 range or even higher, but we do anticipate the rally to pause over the next 2-3 months during the worst two months of the year.
For the past 33 years from 1988-2020 August and September are the worst two months of the year for DJIA, S&P 500 and NASDAQ. August is the worst for DJIA and S&P 500 and September is worst for NASDAQ. August is up only 18 of the past 33 years for DJIA and S&P 500 with average losses of -0.8% and -0.6% respectively. NASDAQ is a bit better in August up 19 of 33 years with an average gain of +0.2%.
September actually has more losses for the Dow (up only 16 of 33, average -0.5%) and S&P (up 17 of 33, average -0.3%). NASDAQ has been up 20 of 33 Septembers with an average loss of -0.1%. The average losses are not huge but the trend of volatility is consistent with a plethora of sizable drops, most notably in August 2015, 2013, 2011, 2010, 2001, 1998, 1997, 1992 and 1990 and in September 2020, 2015, 2011, 2008, 2002, 2001, 2000 and 1990.
Bullish forces continue to persist. The Fed remains easy and accommodative. More fiscal stimulus is likely from Washington as Congress nears finalizing the deals on infrastructure and spending. Economic readings remain robust, but Q2 GDP was below expectations. Q2 earnings season has been rather stellar, but Q3 comps will not be as easy. This Covid-19 Delta variant is a concern and poses a threat to the bull and the economic expansion. Political wrangling here in The States and geopolitical machinations around world could also knock the market off course momentarily.
Despite the persistence and resilience of this bull rally market internals and technicals are showing some signs of fatigue. Advancing issues have barely outpaced decliners in recent weeks. New highs have been shrinking while new lows remain high. Technical indicators are still struggling to break through resistance with Relative Strength, Stochastics and MACD breaking down again.
In addition to the exogenous threats from Covid, U.S. politics, geopolitics, internals and technicals, the timing of a pause coincides with the weak seasonal patterns mentioned above during the worst months of the year August and September (not to mention Octoberphobia) as well as the 4-Year Presidential Election Cycle.
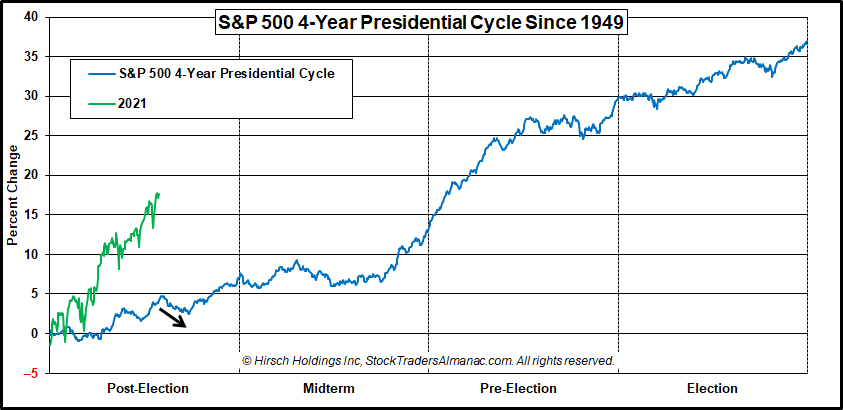
As you can see in the chart here of the Modern 4-Year Presidential Election Cycle indicated by the black arrow we are due for a pause over the next couple of months before the rally resumes in the September/October timeframe. This illustration of the average 4-year cycle uses the S&P 500 back to 1949, which is the first full cycle post-WWII vs. other comparisons that use the Dow back 125 years to 1896.
This more recent dataset is a better representation of the modern cycle where post-election years have been better and election years weaker – impacted by the undecided election in 2000 and the financial crisis of 2008. Midterm years are still lackluster with the propensity for significant bottoms and pre-election years are still the tops.
This creates the sweet spot of the 4-year cycle from Q4 in the midterm year through Q2 in the pre-election year. From the midterm low to the pre-election year high DJIA averages a 44.6% gain since 1950 and NASDAQ averages a 68.2% gain since 1974.
The recent gains are impressive and hard to resist, but history tells us that it is prudent to be cautious at this time of year. We believe it is the best course of action to sit tight, be patient and use the time to prepare for the next Best 6/8 Months Buy Signal and the yearend rally.
AUG
2021