Posts Tagged 'S&P 500'

Market Outlook August 2018: Hot Julys Often Bring Late-Summer/Autumn Buys

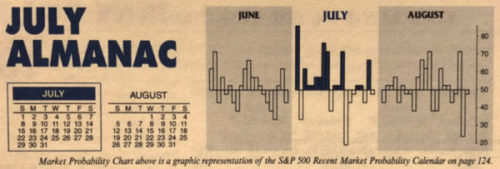
Geopolitical concerns over the past few months from snafus and issues at the U.S. southern border over immigration disputes to tough tariff talk and trade war concerns have been shrugged off by the market since the end of June. Positive Q2 earnings, rising GDP growth, sustained unemployment and low rates continue to please the market, sending the market higher in July. This put DJIA up 4.00%, S&P 500 up 3.75% and NASDAQ up 4.40% for the month of July so ...

Continue Reading →
0

August 2018 Market at a Glance

Seasonal:

Bearish. August is the worst month of the year since 1988. Average losses over the last 30 years range from 0.3% by NASDAQ to 1.2% by DJIA. In midterm years since 1950, Augusts’ rankings improve slightly: #8 DJIA, #9 S&P 500, #11 NASDAQ (since 1974). Average losses range from 0.4% for S&P 500 to 1.8% for NASDAQ. DJIA suffered double-digit losses ...

Continue Reading →
0

August’s First Trading Day Not So Great

From the Stock Trader’s Almanac 2018 (page 86), it is known that the first trading days of each month combined gain nearly as much as all other days combined. However, the first trading day of August does not contribute to this phenomenon ranking worst among other First Trading Days in the 2018 Almanac and even after a modestly positive performance last year it is still the last in the upcoming 2019 edition of the Almanac. In the ...

Continue Reading →
0

Flat-Lining Advance/Decline Lines Flash Warning

At the open of trading today all the major indexes were all in positive territory, but by the closing bell only DJIA and S&P 500 remained in the green for the day, up 0.8% and 0.5% respectively. NASDAQ finished basically flat on the day after surrounding early-day gains in excess of 1%. Russell 2000 had the toughest day, closing down slightly less than 1.1%. This is a reversal of the trend that existed through much of June and the first ...

Continue Reading →
0

Hot July Market Blazes Past Historical Performance

As of today’s close DJIA is up 3.18% thus far in July. S&P 500 is slightly better at 3.26% while Russell 2000 is up 3.37%. NASDAQ is best up 4.41% with another six trading sessions to go in the month. As you can see in the chart below this is well above average historical July performance at this point of the month over the last 21 years. Early month strength (trading days three, four and five) was substantially greater this ...

Continue Reading →
0

July 2018 Market at a Glance

Seasonal:

Bearish. July historically is the best performing month of the third quarter however, the mostly negative results in August and September make the comparison easy. July begins NASDAQ’s worst four months and is the third weakest performing NASDAQ month since 1971, posting a 0.4% average gain. Midterm-year July rankings are something of a mixed bag, ranking #5 for DJIA and ...

Continue Reading →
0

Almanac Update July 2018: Best Month of Q3, But NASDAQ Struggles

July historically is the best performing month of the third quarter however, the mostly negative results in August and September make the comparison easy. Two “hot” Julys in 2009 and 2010 where DJIA and S&P 500 both gained greater than 6% and a strong performance in 2013 have boosted July’s average gains since 1950 to 1.2% and 1.0% respectively. Such strength inevitability stirs talk of a “summer rally”, but beware the hype, as it has historically been the weakest rally ...

Continue Reading →
0

Market Outlook July 2018: June Swoon Indicates Time to Take More Risk Off For Summer

So far our June 21 NASDAQ Best 8 Months Sell Signal has turned out to be rather timely. From our November 28 Buy Signal to our June 21 Sell Signal NASDAQ gained 11.6%. NASDAQ has given back sizeable ground since June 21. The Dow and S&P 500 have been in selloff mode a bit longer since June 13.

We have been getting on the defensive since our May 2 Dow and S&P 500 Best Six Months Sell signal and it now ...

Continue Reading →
0

May 2018 Market at a Glance

Seasonal:

Bearish. May officially marks the beginning of the “Worst Six Months” for the DJIA and S&P. To wit: “Sell in May and go away.” May has been a tricky month over the years, a well-deserved reputation following the May 6, 2010 “flash crash” and the old “May/June disaster area” from 1965 to 1984. Since 1950, midterm-year Mays rank poorly, #9 ...

Continue Reading →
0
Page 18 of 19 «...101516171819