
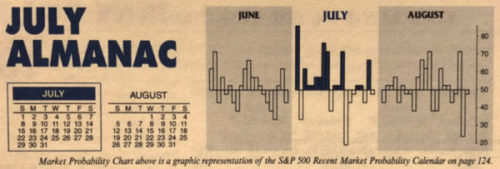
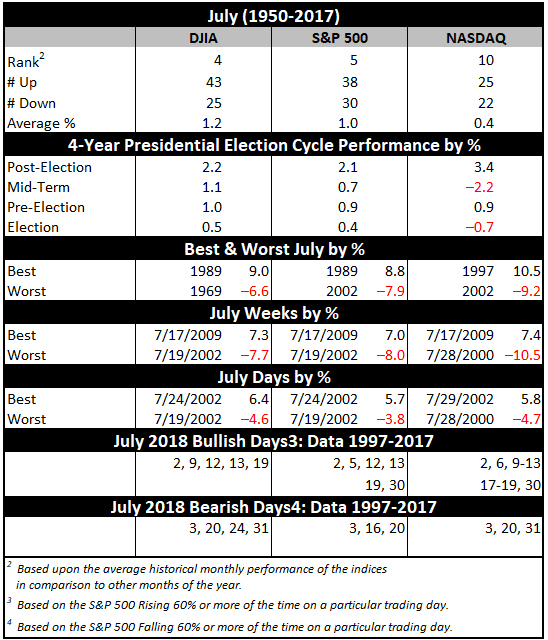
July historically is the best performing month of the third quarter however, the mostly negative results in August and September make the comparison easy. Two “hot” Julys in 2009 and 2010 where DJIA and S&P 500 both gained greater than 6% and a strong performance in 2013 have boosted July’s average gains since 1950 to 1.2% and 1.0% respectively. Such strength inevitability stirs talk of a “summer rally”, but beware the hype, as it has historically been the weakest rally of all seasons (page 70, Stock Trader’s Almanac 2018).
July begins NASDAQ’s worst four months and is the third weakest performing NASDAQ month since 1971, posting a 0.4% average gain. Dynamic trading often accompanies the first full month of summer as the beginning of the second half of the year brings an inflow of new funds. This creates a bullish beginning, a soft week after options expiration and strength towards the end.
July’s first trading day is the second best performing first trading day of all twelve months with DJIA gaining a cumulative 1139.97 points since 1998. Over the past 21 years, DJIA’s first trading day of July has produced gains 81.0% of the time with an average advance of 0.44%. S&P 500 has advanced 85.7% of the time (average gain 0.42%). NASDAQ has been slightly weaker at 71.4% (0.21% average gain). No other day of the year exhibits this amount of across-the-board strength which makes a case for declaring the first trading day of July the most consistently bullish day of the year over the past 21 years.
Trading on the day before and after the Independence Day holiday is often lackluster. Volume tends to decline on either side of the holiday as vacations begin early and finish late. Since 1980, DJIA, S&P 500 and NASDAQ have recorded net losses on the day after.
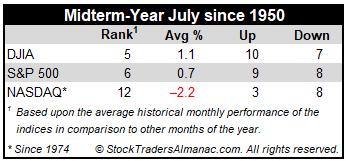
Midterm-year July rankings are something of a mixed bag, ranking #5 for DJIA and #6 S&P 500, averaging gains of 1.1% and 0.7% respectively (since 1950); while NASDAQ (since 1974) midterm Julys rank #12. NASDAQ has only advanced in three of the last eleven midterm Julys with an average loss of 2.2%.
JUL
2018