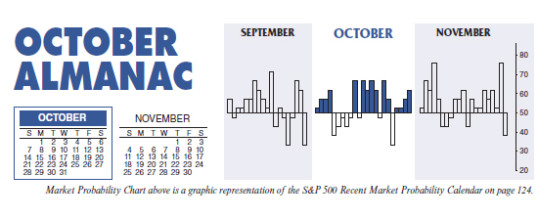
Posts Tagged 'S&P 500'

Market Outlook October 2018: Midterm October Launching Pad

Historically, the “Worst Six Months” (WSM) of the midterm year has been weaker than WSM in all other years of the 4-Year Presidential Election Cycle, with Q2-Q3 of the midterm year being the weakest consecutive two-quarter combo of the cycle. August and September have historically been the worst two months of the year, though they rank higher in midterm years, but have still posted average losses in midterm years since 1950.

This has not been the case this year. Despite a ...

Continue Reading →
0

Almanac Update October 2018: Best Month of Midterm Year

October often evokes fear on Wall Street as memories are stirred of crashes in 1929, 1987, the 554-point drop on October 27, 1997, back-to-back massacres in 1978 and 1979, Friday the 13th in 1989 and the 733-point drop on October 15, 2008. During the week ending October 10, 2008, Dow lost 1,874.19 points (18.2%), the worst weekly decline in our database going back to 1901, in point and percentage terms. The term “Octoberphobia” has been used to describe the phenomenon ...

Continue Reading →
0

Typical September Trading: Another Historically Challenging Month

Although August is the worst month of the year for the market since 1987 (recent 31-year period), September is the worst month going back to 1950 for DJIA and S&P 500. It is also the worst month for NASDAQ since 1971 and the worst for Russell 1000 and 2000 since 1979. Looking at the full month of September one day at a time, just before mid-month has offered the bulls the best opportunity with the chart exhibiting strength from around ...

Continue Reading →
0

Almanac Update September 2018: Midterm Elections Further Quell Returns

Since 1950, September is the worst performing month of the year for DJIA, S&P 500 and NASDAQ (since 1971). September was creamed four years straight from 1999-2002 after four solid years from 1995-1998 during the dot.com bubble madness. Although September’s overall rank improves modestly in midterm years going back to 1950, average losses widen for DJIA (–1.0%) and NASDAQ (–0.8%). S&P 500’s average September loss improves slightly from –0.5% to –0.4% in midterm years. Although September 2002 does influence the ...

Continue Reading →
0

September 2018 Market at a Glance

Seasonal:

Bearish. September is the worst performing month of the year for DJIA, S&P 500, NASDAQ (since 1950), Russell 1000 and Russell 2000 (since 1979). In midterm years going back to 1950, average losses widen for DJIA (–1.0%), NASDAQ (–0.8%), Russell 1000 (–1.1%) and Russell 2000 (–0.6%). S&P 500’s average September loss improves slightly from –0.5% to –0.4% in midterm years.

Continue Reading →
0

Market Outlook September 2018: Tumultuous Month Often Bucks Bulls Off Easy Ride

Midterm years are notoriously a rough year for markets as presidents push through their most disruptive policy initiatives and battle the opposition party to retain congressional seats. But the last three midterm years, 2006, 2010 and 2014 have been strong followed by troubled pre-election years. 2007 brought us the major top of the Financial Crisis with the S&P up 3.5%. 2011 suffered a mini-bear from April to October that shaved 19.4% off the S&P, which ended the year down a ...

Continue Reading →
0

This Is NOT the Longest Bull Market

Hold the champagne! This is not the longest bull market on record or since WWII as the current buzz on The Street would have you believe. On August 22, 2018 some market analysts will deem this the longest bull market on record having avoided an “official” 20% bear market for 3453 calendar days, surpassing the October 11, 1990 to March 24, 2000 bull market – but we respectfully disagree.

We have tracked bull and bear markets with objectivity for more than ...

Continue Reading →
0

Almanac Update August 2018: Worst Month of the Year

Money flows from harvesting made August a great stock market month in the first half of the Twentieth Century. August was the best month from 1901 to 1951. In 1900, 37.5% of the population was farming. Now that less than 2% farm, August is amongst the worst months of the year. It is the worst DJIA and S&P 500 month since 1987 with average declines of 1.0% and 0.8% respectively. August is also the worst month for NASDAQ (–0.1%) over ...

Continue Reading →
0
Page 17 of 19 «...101516171819