Posts Tagged 'Seasonal'

Almanac Update January 2019: Top Month for Stocks in Pre-Election Years

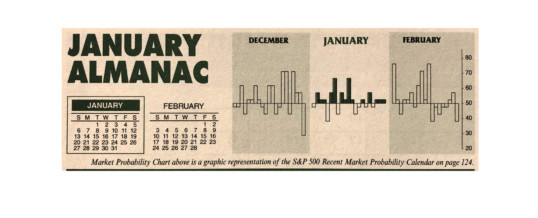
January has quite a legendary reputation on Wall Street as an influx of cash from yearend bonuses and annual allocations typically propels stocks higher. January ranks #1 for NASDAQ (since 1971), but sixth on the S&P 500 and DJIA since 1950. It is the end of the best three-month span and holds a full docket of indicators and seasonalities.

DJIA and S&P rankings did slip from 2000 to 2018 as both indices suffered losses in ten of those nineteen Januarys with ...

Continue Reading →
0

December 2018 Market at a Glance

Seasonal:

Bullish. December is the number one S&P 500 (+1.6%) month and second best for DJIA (+1.7%) and NASDAQ (1.8% since 1971). Rarely does the market fall precipitously in December. The “January Effect” of small-cap outperformance starts in mid-December. Santa’s Rally begins on Monday December 24 and lasts until the second trading day of the New Year. S&P has averaged gains ...

Continue Reading →
0

Nasty Thanksgiving Week Does Not Signal Market Demise

Hold on a second. Yes, this was the worst Thanksgiving week for the S&P 500 since 2011 and the 5th worst since 1930. But this does not mean the bull market is over for stocks and there is no upside. Just look at the table below of the S&P 500’s performance following all down Thanksgiving weeks since 1930.

Sure the market was horrible back in the 1930s at the depth of the Depression, but 1933 was up 46.6% following down T-Week ...

Continue Reading →
0

Almanac Update November 2018: First of the “Best Months”

November maintains its status among the top performing months as fourth-quarter cash inflows from institutions drive November to lead the best consecutive three-month span November-January. The month has taken hits during bear markets and November 2000, down –22.9% (undecided election and a nascent bear), was NASDAQ’s second worst month on record—only October 1987 was worse.

November begins the “Best Six Months” for the DJIA and S&P 500, and the “Best Eight Months” for NASDAQ. Small caps come into favor during November, ...

Continue Reading →
0

Market Outlook November 2018: Midterm Time Is Bullish

For the past several months we have often heard investors and commentators saying, “Sell in May did not work this year and it hasn’t worked for the past several years” or “Sell in May is dead.” Not true. Everyone forgot about October. We always are leery of October.

The recent spell of 2-3% daily market moves has many concerned that this could turn into something more sinister or bearish. That is always a concern and still possible, but it does not ...

Continue Reading →
0

So “Sell in May” Didn’t Work This Year?

Not so fast. The answer is: We don’t know yet, the Worst Six Months (WSM) are not over yet. People forget that Sell in May is NOT the whole seasonality. Our Best and Worst Months Tactical Switching Strategies are based on the Dow’s and S&P’s Best Six Months (BSM) from November through April and the Worst Six Months from May through October, and NASDAQ’s Best Eight Months (B8M) from November through June and the Worst Four Months (W4M) from July ...

Continue Reading →
0

Octoberphobia Strikes Again

Okay. Everybody relax. This is normal. This is a standard October seasonal selloff. There is a long and recent history of this sort of October market volatility. Today the market suffered its worst DJIA and S&P day since February 8, 2018 and the worst NASDAQ day by percent since June 24, 2016, the day after the Brexit vote.

This is typical October behavior. And like we said last week this is to be expected at the beginning of ...

Continue Reading →
0
Page 9 of 12 «...7891011...»